
At the height of contract negotiation tension between Lamar Jackson and the Baltimore Ravens, many teams had to have been speculating about the value he could provide if he became available. He was certainly a unique talent, but also played in unique circumstances, including a very run-centered offensive system. Comparisons to current options on other teams with different systems would be difficult to make.
For the Ravens, however, that assessment likely required a little less extrapolation. They had seen firsthand what his understudy, Tyler Huntley, had done with the same playcaller and teammates. Moreover, Huntley was successful enough in relief to earn a Pro Bowl appearance in 2023, and a restricted free agent at the time. The 2023 offseason required that the Ravens figure out whether they should keep Jackson, Huntley, both, or even move on from both.
We can put ourselves in the shoes of the Ravens front office and start with the question: “How much of a difference is there between Jackson and Huntley’s contributions?” Naturally, we’d start by comparing how the offense performed with each at the helm, using a metric such as expected points added (EPA), and perhaps create splits to see if either excelled at a given play type. We’ll use data graciously made publicly available through the nflverse R packages, focusing on the 2021 and 2022 seasons where both played a substantial number of snaps.
Figure 1.
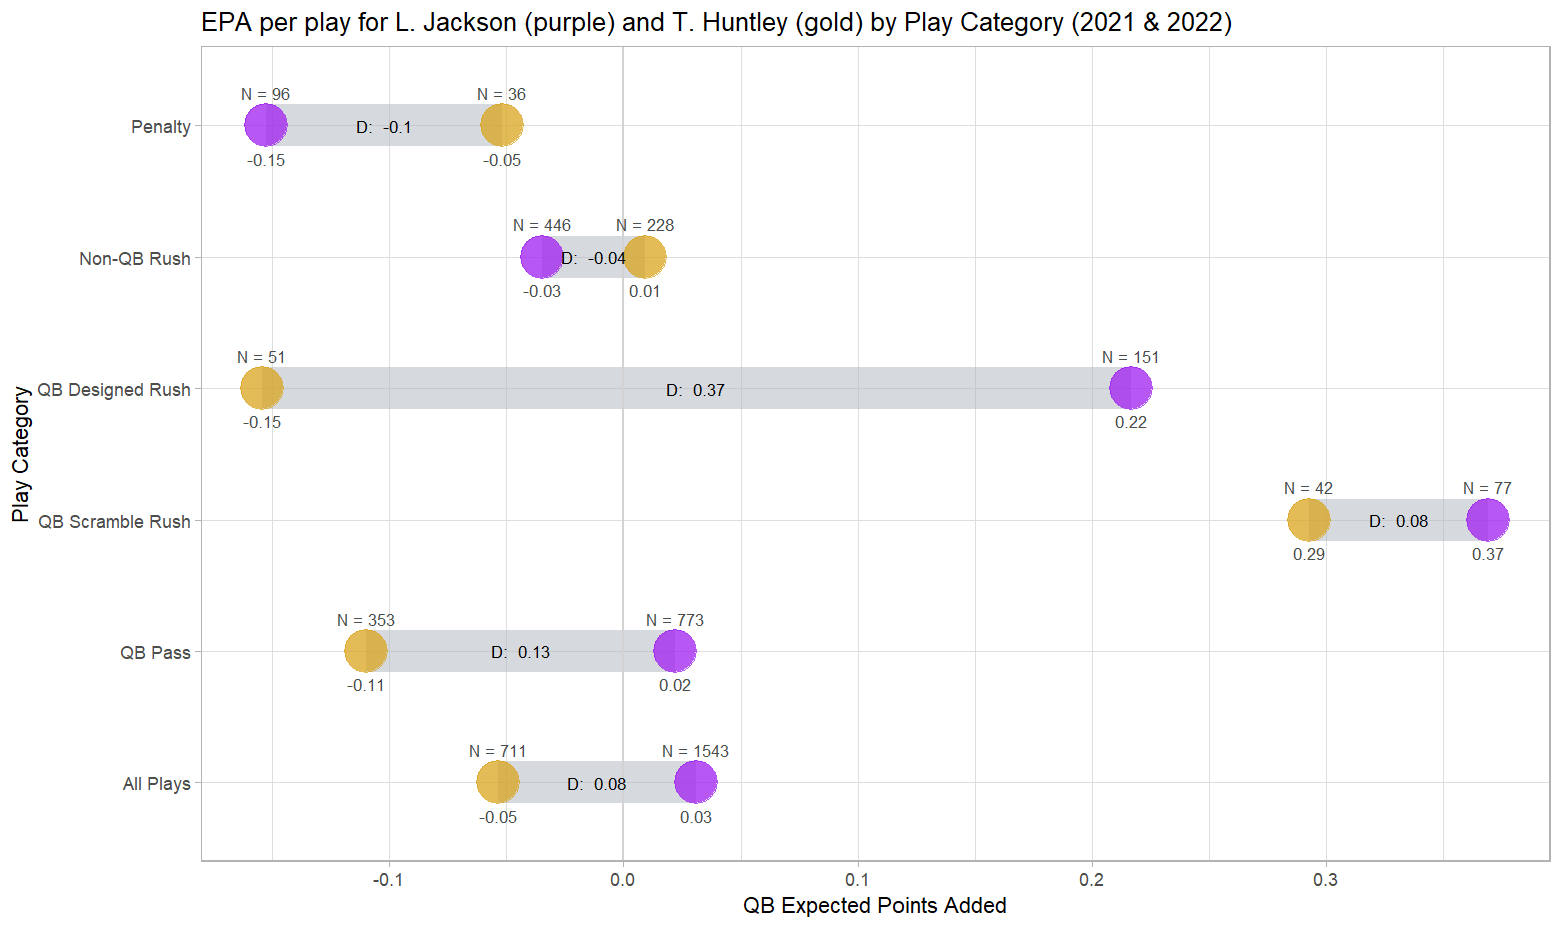
At the bottom, you can see a seeming innocuous overall difference in average EPA (0.08) between Jackson and Huntley across all their plays. But you can also see that for plays involving the QB either dropping back or running intentionally, Jackson outperformed Huntley. The running game seemed to perform slightly better with Huntley as the field general, however. (QB scrambles look particularly good because those ending behind the line of scrimmage are recorded as QB pass)
We should still check how situationally similar their circumstances were. A quick look at the statistics doesn’t reveal any extreme differences in the percentage of plays run in each category, or the downs faced. When looking at who else was on the field, there were some differences in which personnel groupings each played with. Jackson played with 3WR sets most often, while Huntley played with 2WR, 3WR, and 4WR formations in fairly similar proportions. This likely impacted personnel groupings across the ball to some extent, with defenses fielding more 6 DB personnel for Huntley and more 4 and 5 DB groups for Jackson.
Likely related to those personnel grouping differences is the fact that Huntley was statistically more likely to be playing from behind (average winning percentage = 47% vs. 59% for Jackson, and in on more plays with higher passing likelihood (60% for Jackson, 67% for Huntley). So, even comparisons within a team have caveats. The question is, can we achieve a more direct and informative comparison than our side-by-side looks at EPA? Hopefully, I can get at that question better in a future post.
Postscript: Going back to Figure 1, I know Lamar Huntley isn’t exactly a highly regarded rusher, but why is his EPA on designed runs so poor?
Sam Hubbard takes the fumble 98 yards for the TD ??????
????: #BALvsCIN on NBC
????: Stream on NFL+ https://t.co/hNJJJGqxGF pic.twitter.com/PoVImXrfpz— NFL (@NFL) January 16, 2023
Ah, one play with almost the worst possible EPA might hurt the average a bit. Maybe we won’t hold that against him in future analyses.