| Cleaning Step | Rides remaining |
% omitted |
|---|---|---|
| Initial Dataset | 5,829,030 | — |
| 1. Remove rides missing/""0"" geographic coordinates" | 5,823,061 | 0.10 |
| 2. Remove ride times <0 or more than 24h | 5,822,823 | 0.00 |
| 3. Remove rides with "Charging Stn"/"Base"/"Company Site" in ride start or end station name/ID | 5,736,181 | 1.49 |
| 4. Remove rides listed from docked bikes | 5,582,410 | 2.68 |
| 5. Remove implausible ride times (less than 2 minutes) | 5,332,422 | 4.48 |
| 6. Remove rides requiring unlikely speeds (> 30mph) | 5,332,341 | 0.00 |
Portfolio
news
code
analysis
Published Research Examples (Available for Free)
Ambient Ozone and Respiratory Emergency Visits
- Cited by EPA regulatory documents on the ozone air pollution standard
Coarse Particulate Matter and Respiratory Emergency Visits
- Cited by EPA regulatory documents on the particulate matter air pollution standard
Cyclistic Bike Share - Data Analyst Case Study
I prepared this longer form report for the Capstone Project of the Google Analytics Data Certificate Program to exemplify a typical data analysis workflow and product. It was an opportunity to engage in problem-solving around a dataset, and utilize Excel and SQL skills honed during the program to examine its quality and identify issues (with some constraints due to data size). I then used skills learned for R and Tableau to clean, summarize, analyze, and create visualizations of the data to suggest and support specific actions addressing the goals of the hypothetical business.
Background
The fictional Cyclistic BikeShare company operates in and around Chicago. It rents out electric and manual bicycles from over 1000 locations (counting both docks and sanctioned public bicycle racks) on a per-ride, day-pass, and annual subscription basis. Its current objective is to increase revenues by converting casual users into annual subscribers, which are more profitable customers. As a junior data analyst in this hypothetical scenario, I have been tasked with ascertaining patterns from ride-level data to efficiently target marketing efforts.
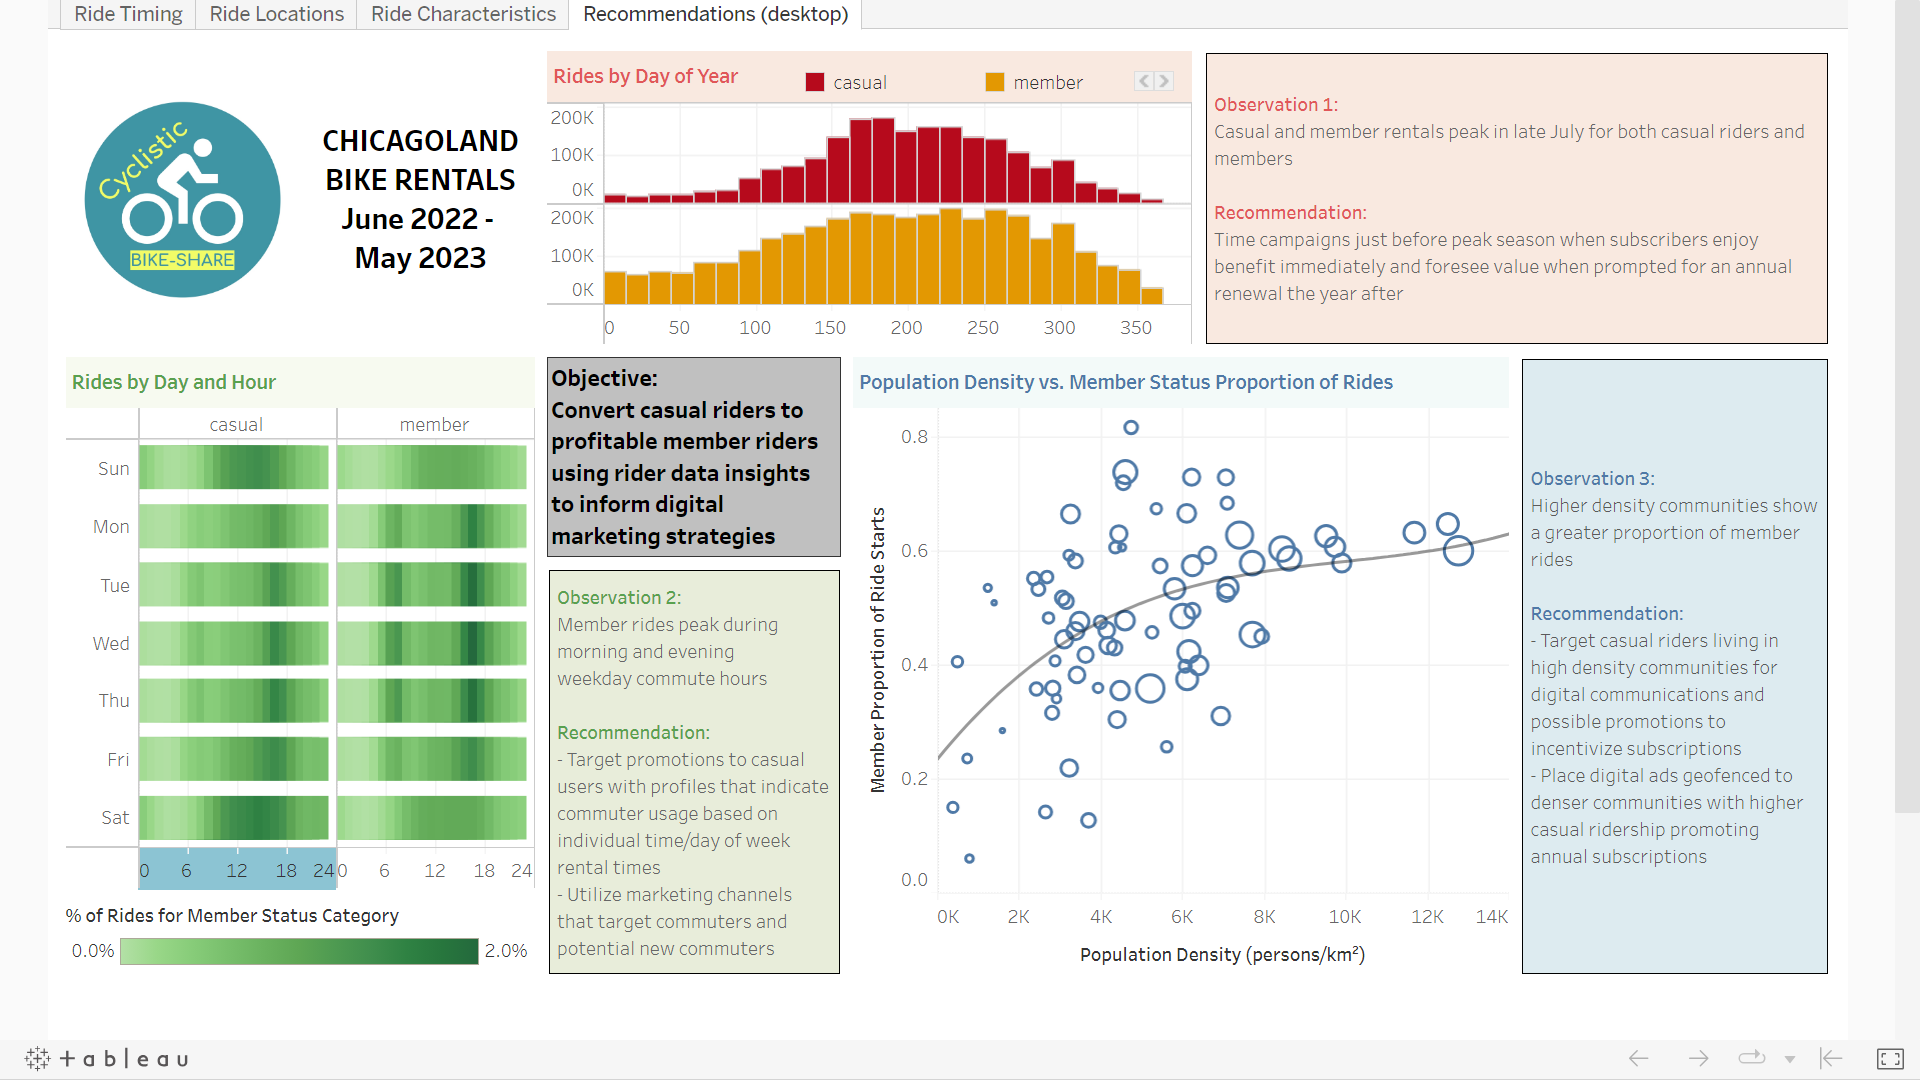
Business Task: Using ride-level data, assess differences in bike share usage between casual riders (single-ride or day pass users) and annual subscribers to guide digital marketing efforts in converting current casual riders to more profitable subscriptions.
I researched the real-life company from which the data is based to provide important context and expected ranges for the data. The ride-level data itself, which lacks person-level identifiers, is non-ideal for predicting rider-level differences given likely repeated instances of the same individuals for different rides without the ability to link them. However, I engaged with task as an academic exercise to demonstrate the steps involved in conducting this type of analysis.
Data Sources
Ride Data - https://divvy-tripdata.s3.amazonaws.com/index.html
- June 2022-May 2023
- under license from Lyft Bikes and Scooters, LLC
Community Boundaries - City of Chicago Data Portal
- 77 communities of Chicago designated historically for statistical and planning purposes
- Purpose: To examine relationships in aggregated neighborhood units
Community Statistics - Wikipedia
- Population Density
L-Train Station Sites - City of Chicago Data Portal
- Locations of Chicago’s local rail transit system, the “L”
- Purpose: To examine whether rider might be more apt to subscribe in places where public transportation is less available, or if it’s possibly being used to link to public transit
Data Questions/Cleaning
Initial explorations of the data were done using Google Sheets and SQL to easily assemble quick descriptives of the data. However, the number of rides across the year and the need to ultimately create a large number of visualizations drove my choice to conduct data processing in R, with additional visualization done in Tableau.
A number of questions arose for which, were this not in an academic scenario, would necessitate additional followup with the ride data aggregators:
Are rides missing station IDs but with endpoint coordinates valid?
- Could be rides parked at non-station locations, reported as allowable by the service under certain conditions and for an extra fee
Why are there so many short rides?
- A large portion of rides reported in raw data fall under 5 minutes, but examination of many of those rides appear plausible given the ride distances and durations reported
Why are docked bikes exclusively used by casual riders?
- Since no members are ostensibly allowed to use this service, we assume this is situationally separate from our business task
Why are coordinates more accurate for some stations that others?
- For our purposes, we assume all coordinates are, but that means some trips are more accurate for calculated distance and community than others
Some noted issues may be intentional induced to protect user identity in the process of making this data publicly available. Using general information provided by Divvy (e.g. permitted rental time), I made some decisions to reshape the data for improved confidence in its findings.
Exclusions
A number of data points were excluded based on doubts of their veracity as a valid ride:
Other value transformations (e.g. omitted station names) were generally limited to fairly small numbers of rides. Also, additional calculated variables (e.g. estimated ride distance using ride start and end coordinates) are noted in the R code saved on Github.
Analysis
Parallel Tableau visualizations available:
Ride Locations
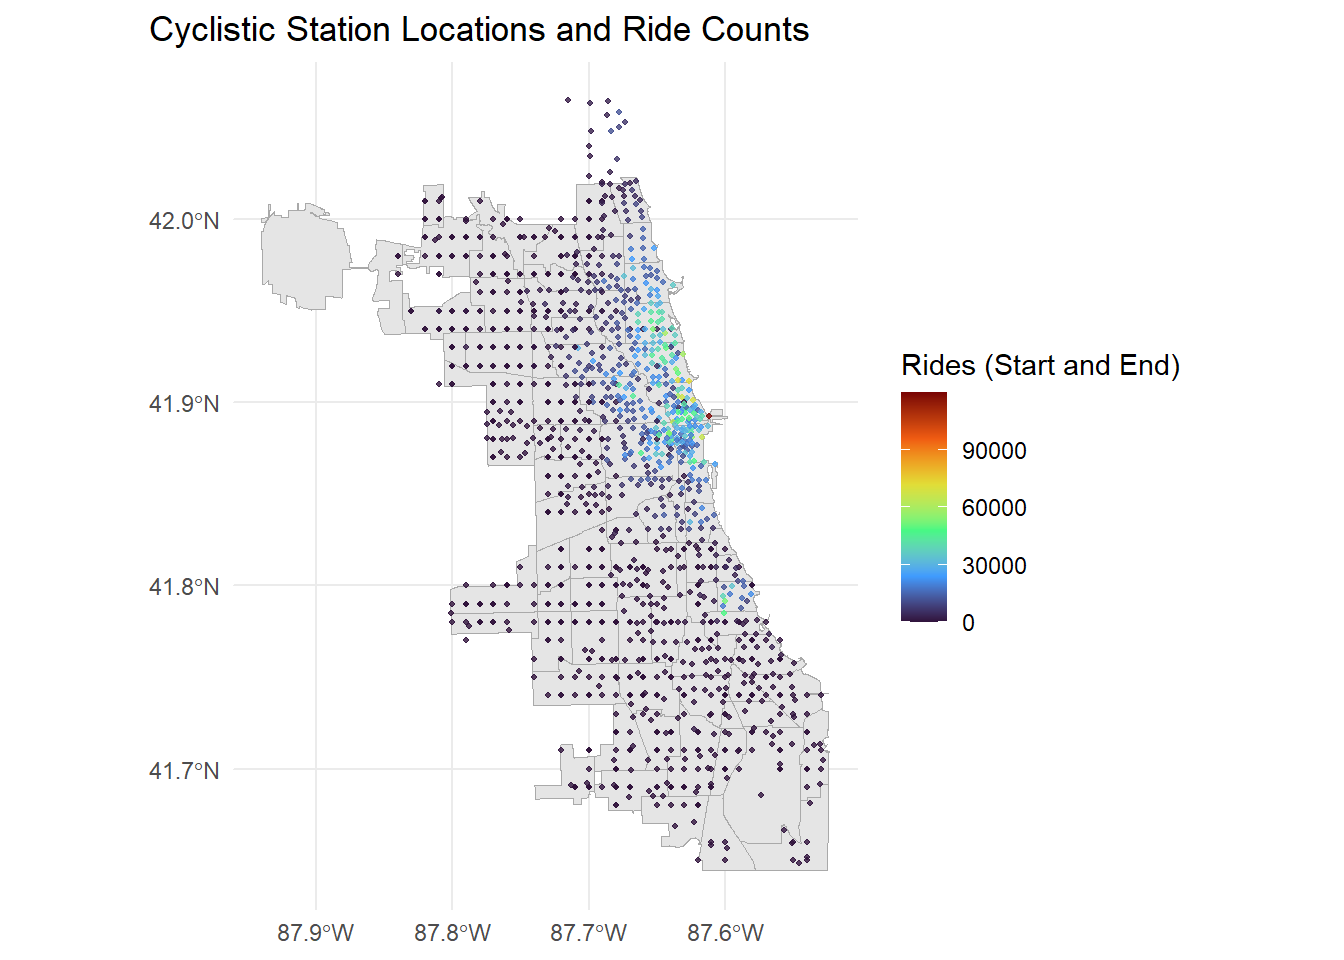
Initial Observations
- Busiest stations are located in the North Side of Chicago towards the lakeshore east of the city
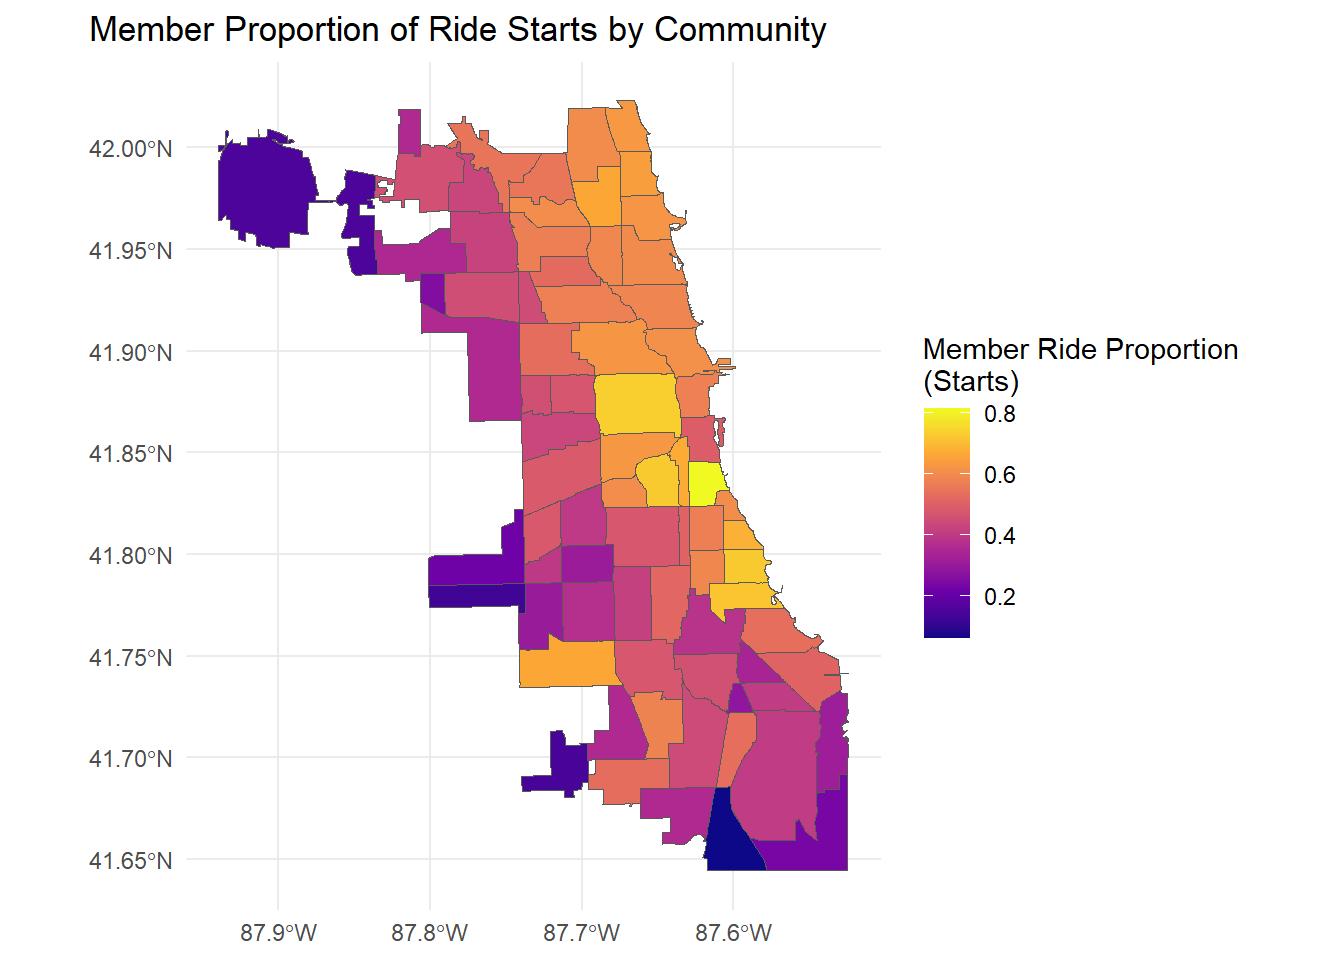
Initial Observations
- Communities with a greater share of casual rides are generally farther from the lake and Eastern edge of the city
- The Loop, a neighborhood containing the city’s central business district and a large number of tourist attractions, has the greatest share of rides from subscribers
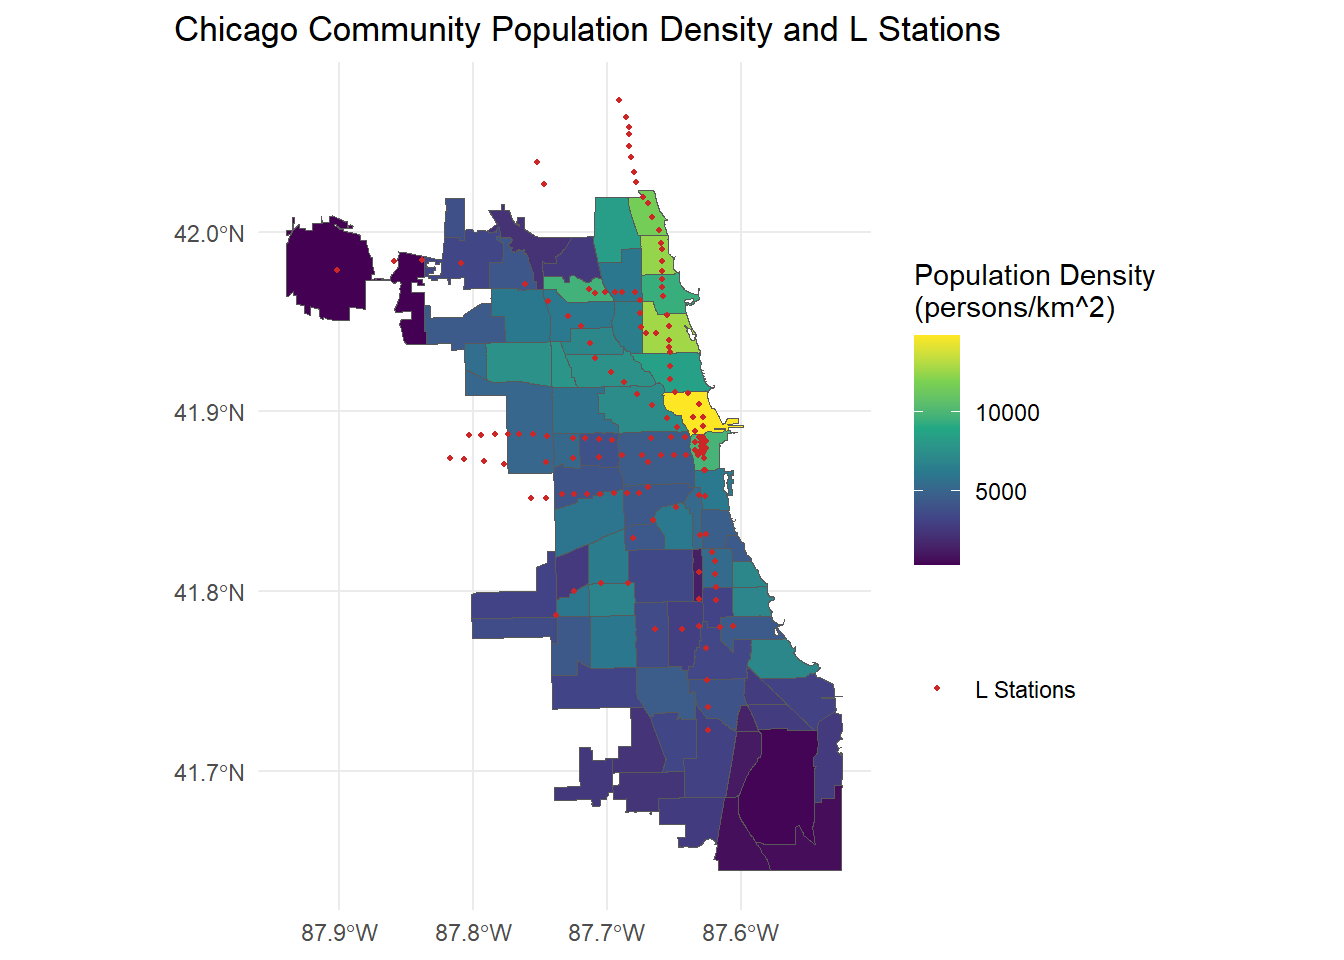
Initial Observations
- Neighborhoods north of the city center and by the lake are generally more densely populated
| Characteristic | casual N = 2,037,8381 |
member N = 3,294,5031 |
|---|---|---|
| Start Stn Outside Chicago | 34,080 (1.7%) | 35,437 (1.1%) |
| End Stn Outside Chicago | 36,019 (1.8%) | 37,608 (1.1%) |
| One Station > 800m of L, Other < 250m of L | 206,226 (10%) | 288,560 (8.8%) |
| Both Start and End > 800m from L-Train Stn | 280,942 (14%) | 344,207 (10%) |
| 1 n (%) | ||
Initial Observations
- No strong case for lack of nearby rail transit or the need to connect to such rail transit as a powerful driver of rides taken among subscribers
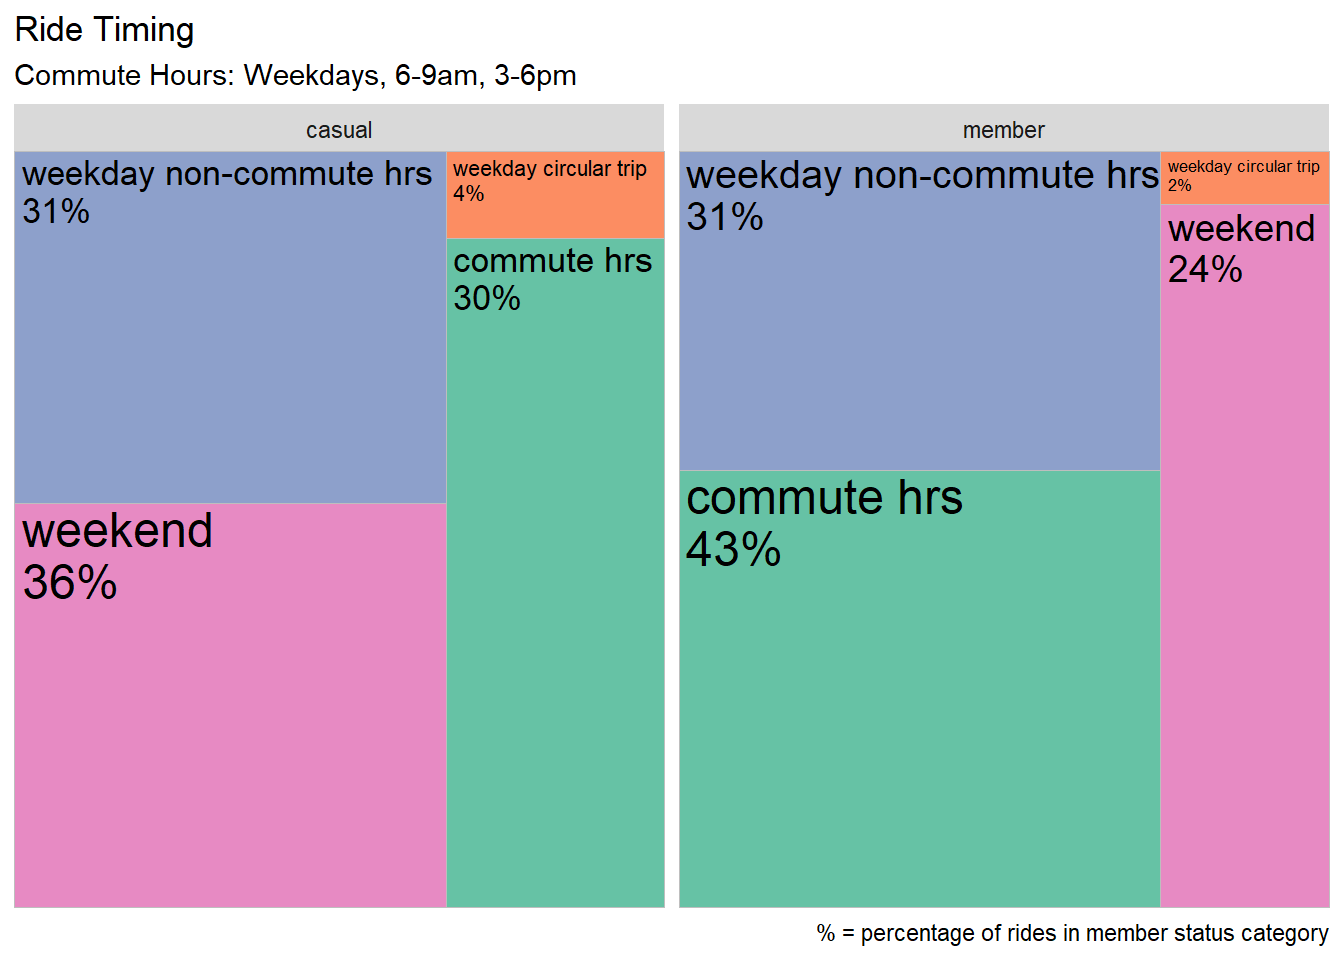
Ride Timing
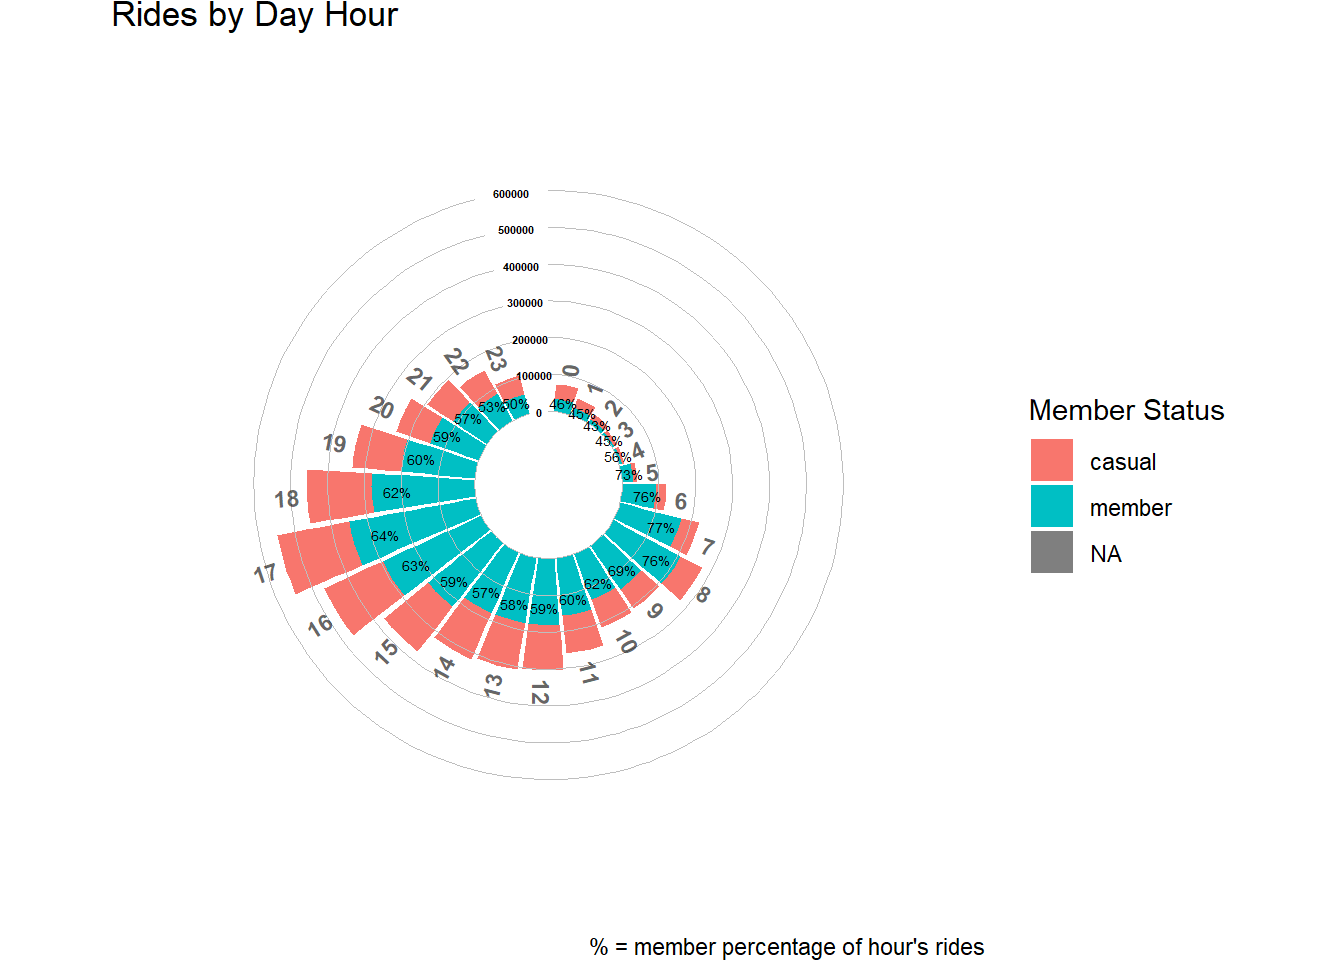
Initial Observations
- Members comprise a greater proportion of rides during the morning and late afternoon/evening times
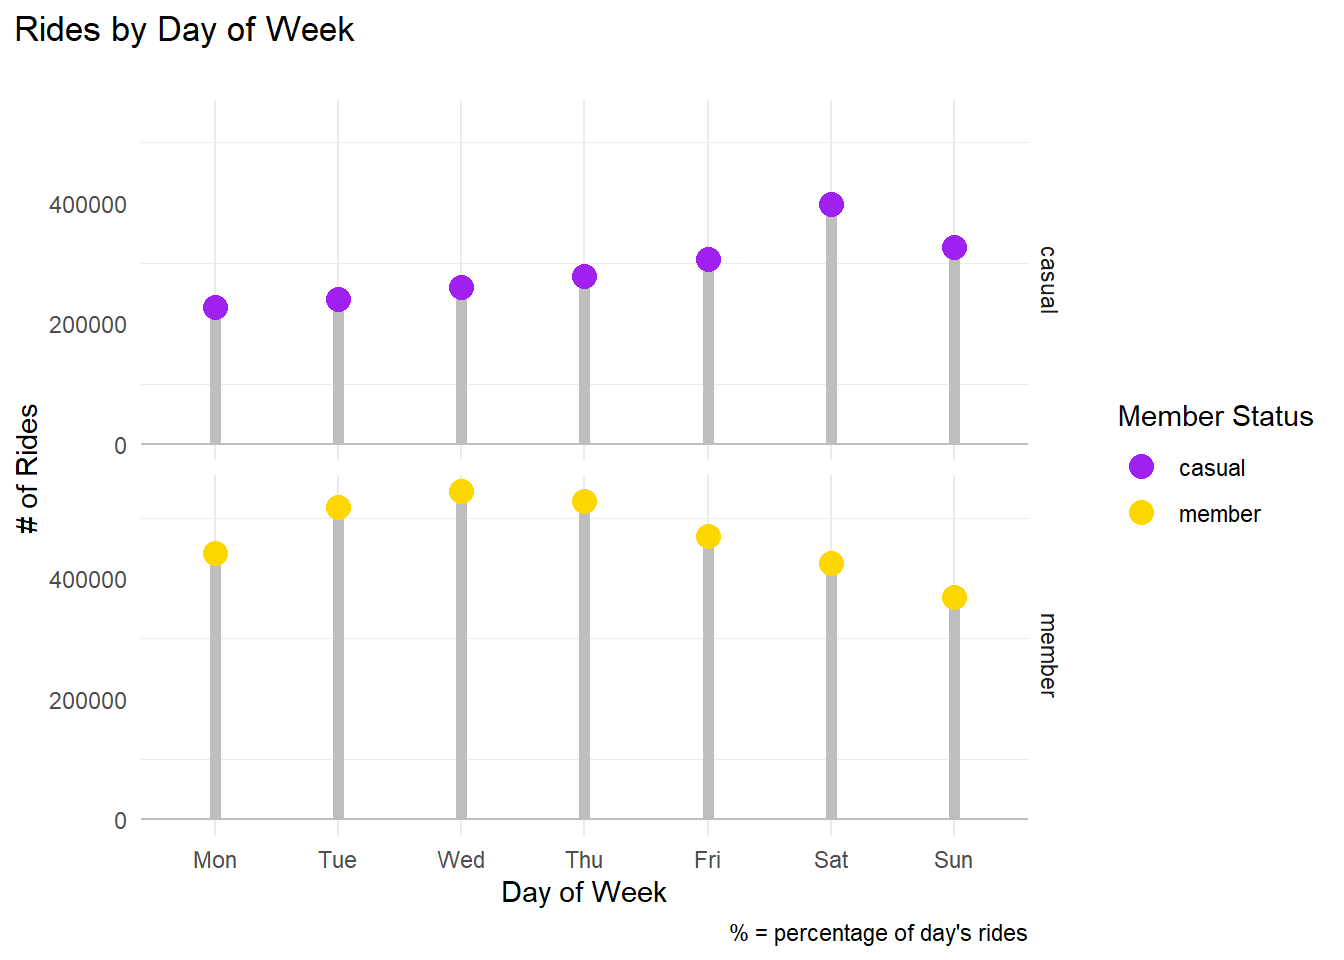
Initial Observations
- Member rides peak midweek, while casual rides peak on weekends
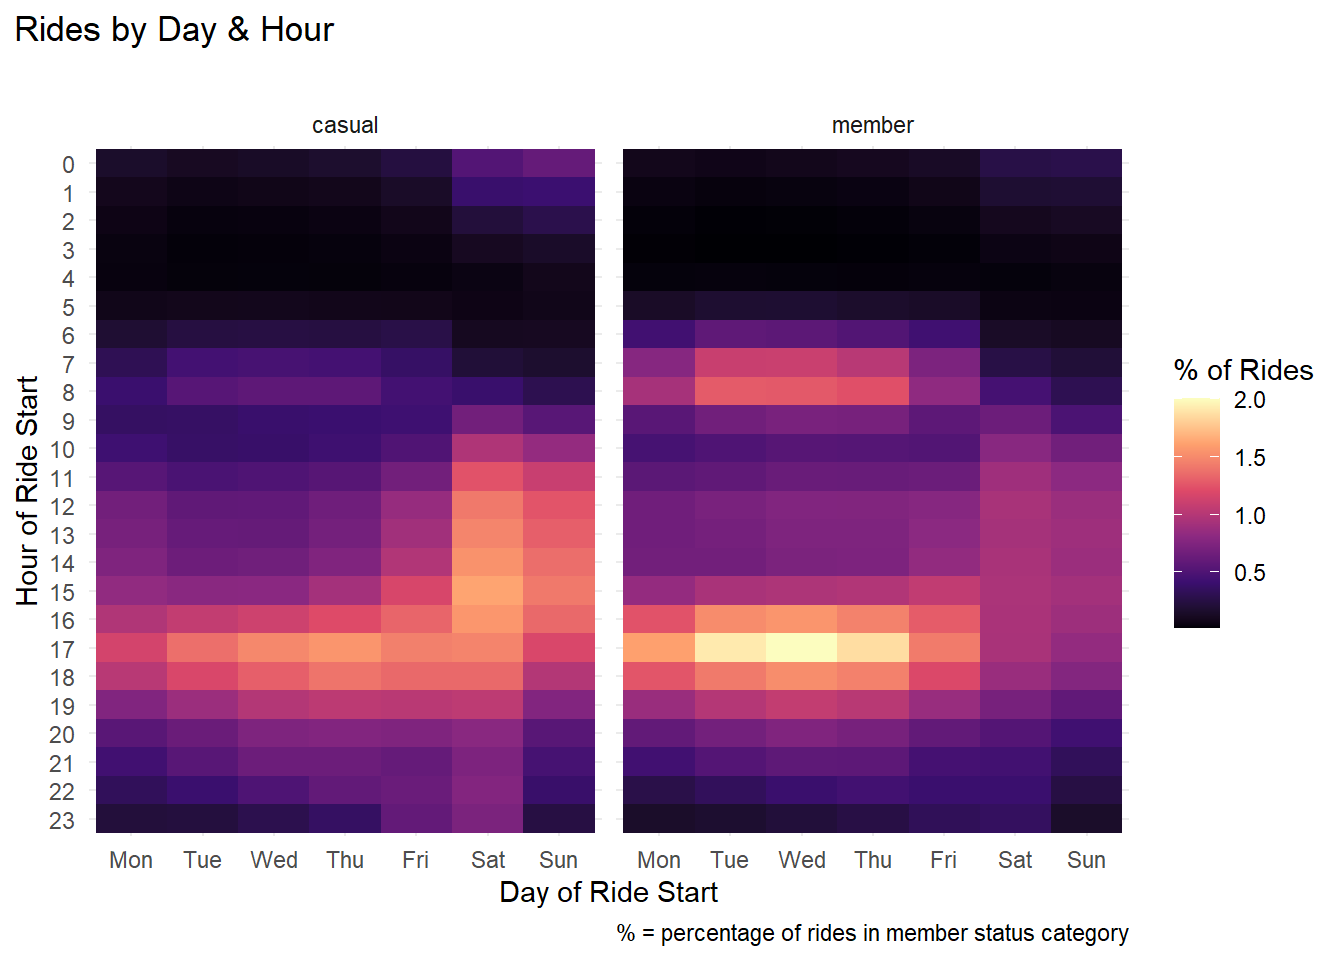
Initial Observations
- For member rides, a greater proportion take place during traditional weekday commute hours
- For casual rides, a greater proportion take place during weekends and late afternoon/evening hours
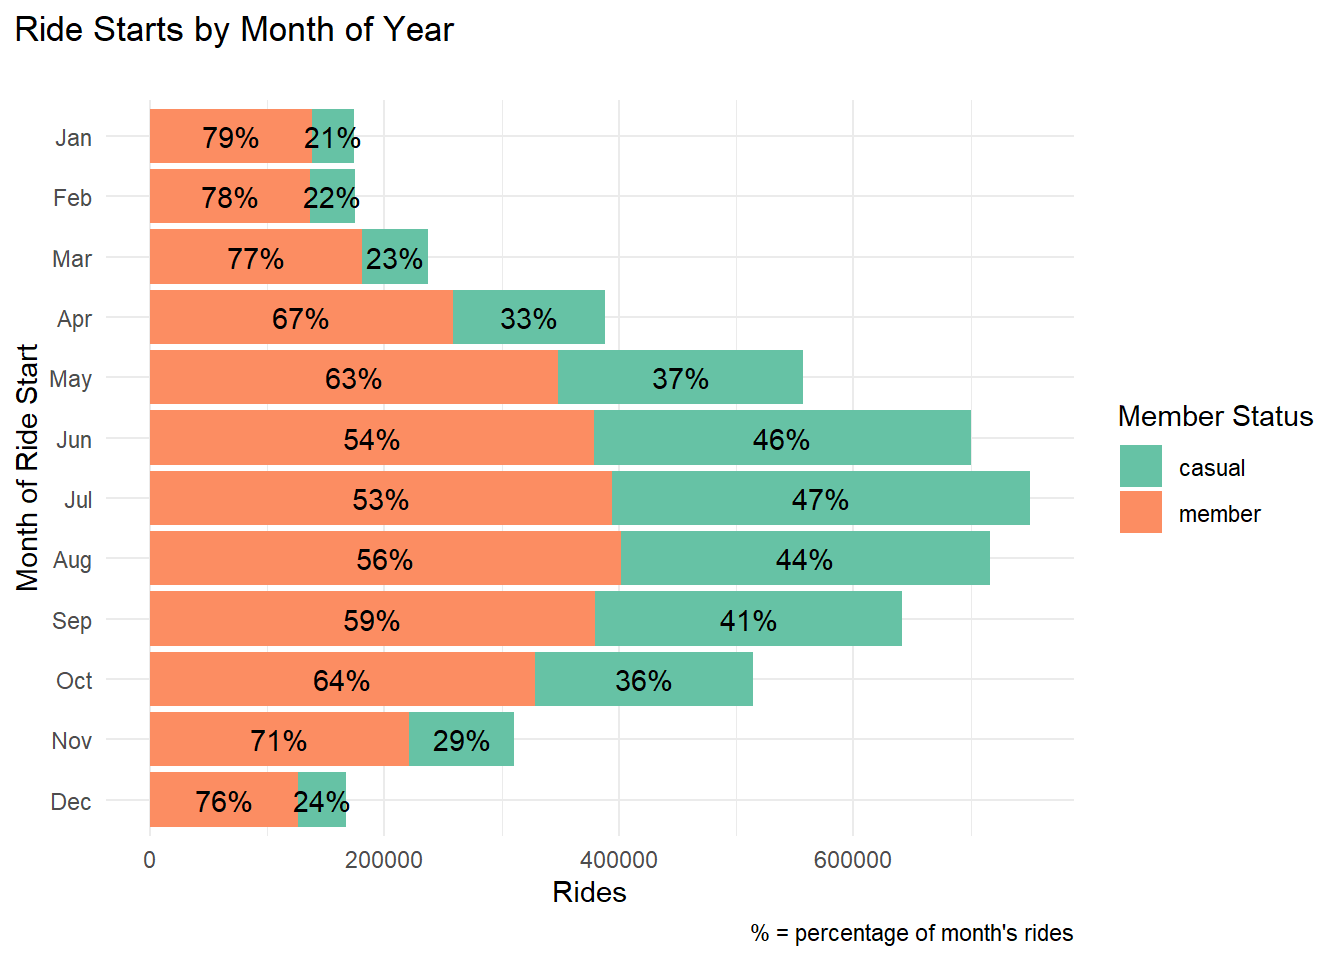
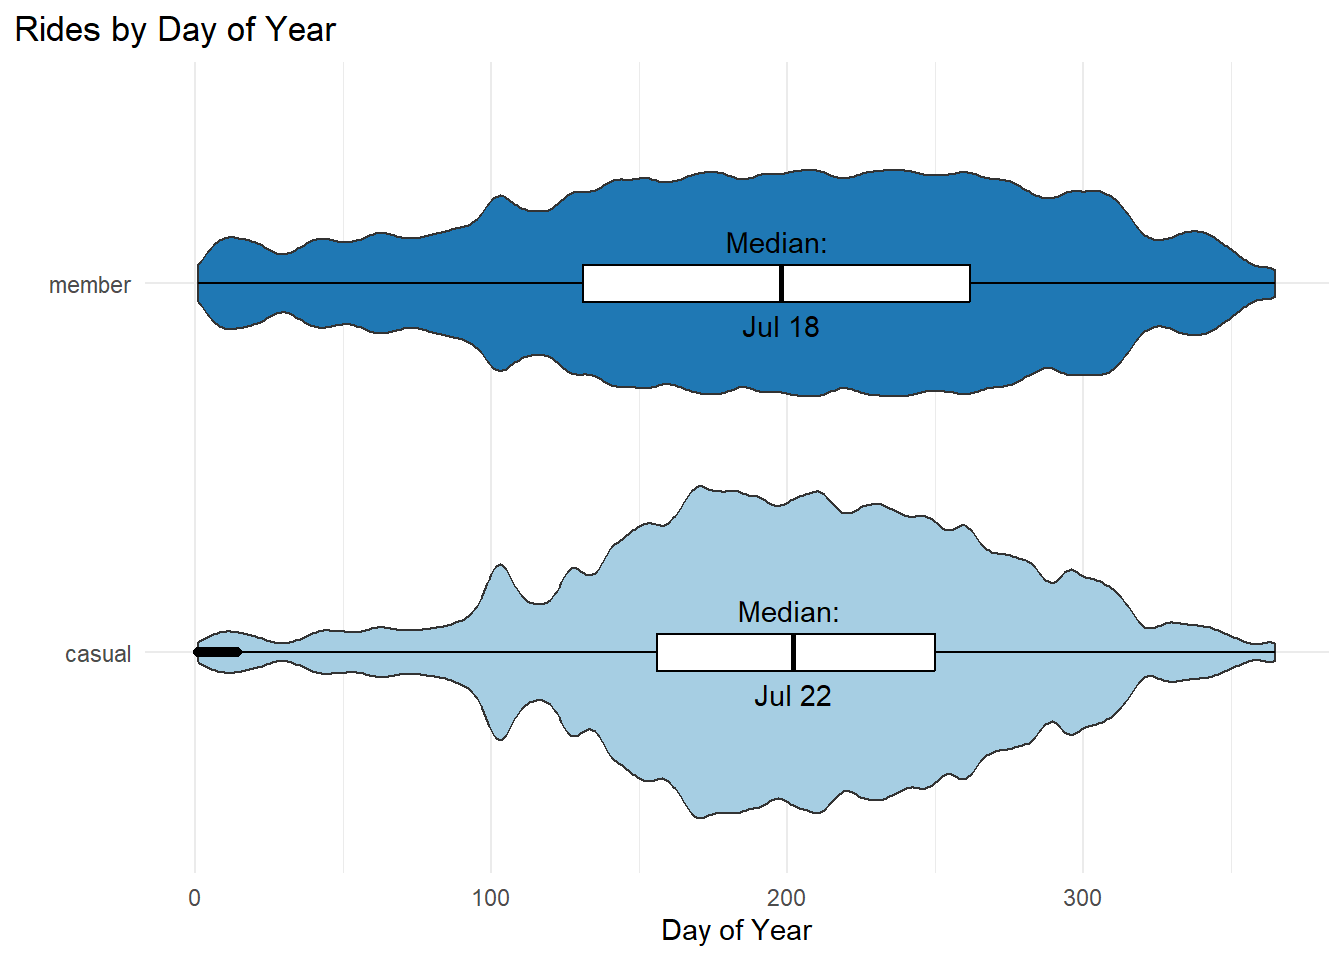
Initial Observations
- Casual and member rides both peak in the summer and are much more sparse in winter
- Member rides are a bit more spread across the year
Ride Characteristics
| Characteristic | casual N = 2,037,8381 |
member N = 3,294,5031 |
|---|---|---|
| Electric Bike | 1,220,505 (60%) | 1,656,745 (50%) |
| Starts and Ends at Same Station | 129,900 (6.4%) | 85,245 (2.6%) |
| Starts or Ends at a Public Rack | 16,099 (0.8%) | 17,550 (0.5%) |
| Start or End Station Not Listed | 159,057 (7.8%) | 183,286 (5.6%) |
| 1 n (%) | ||
Warning in fortify(data, ...): Arguments in `...` must be used.
✖ Problematic argument:
• color = "black"
ℹ Did you misspell an argument name?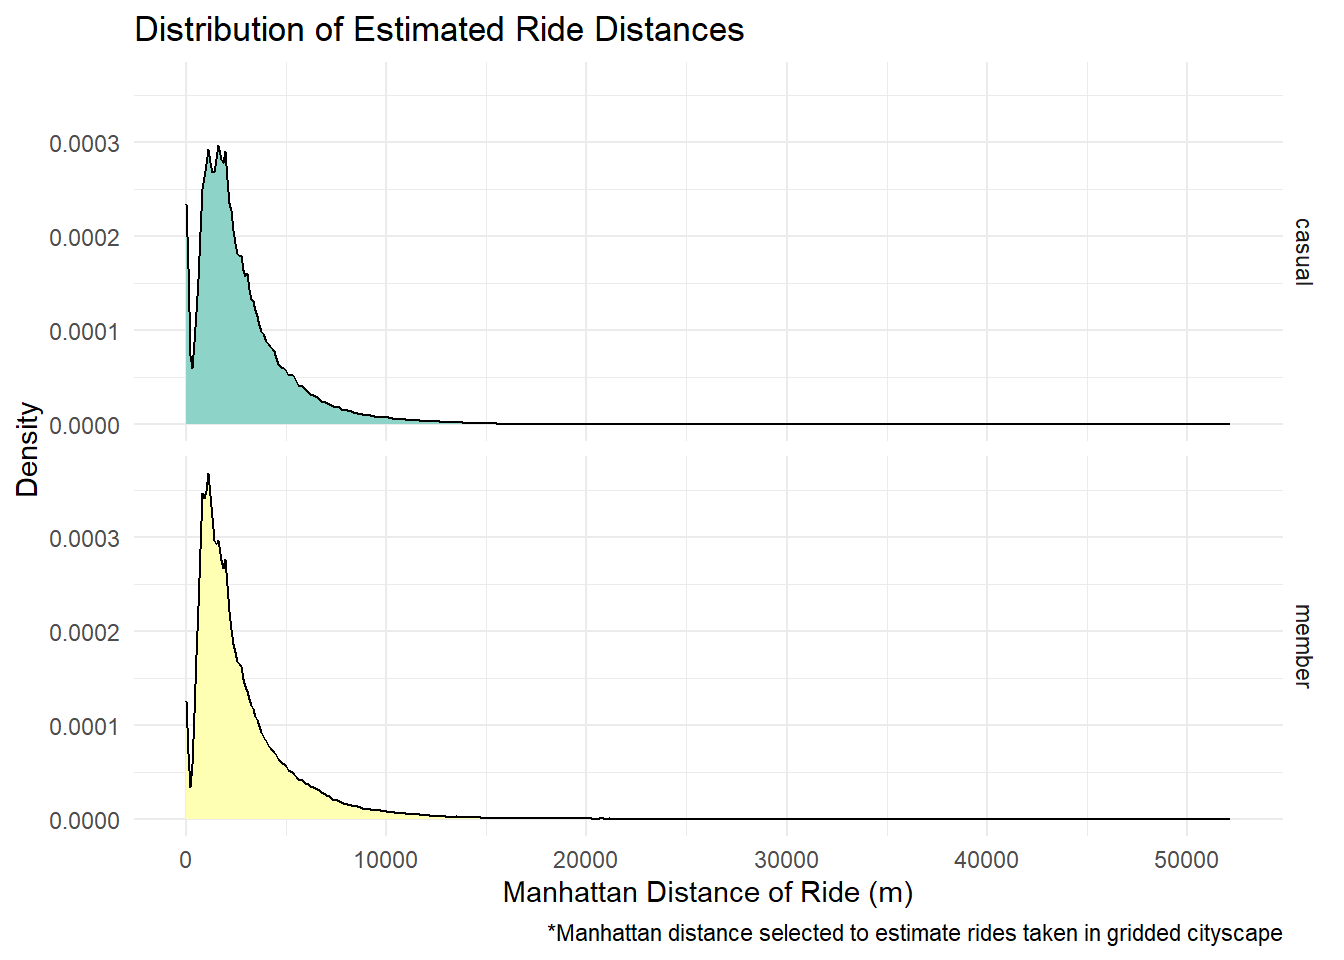
Initial Observations
- Estimated ride distances ranged more widely for casual rides, with more trips ending at the same station but also more trips of longer distances
- Zero ride distance for those starting and ending at same station are obviously underpredictions for actual distances ridden
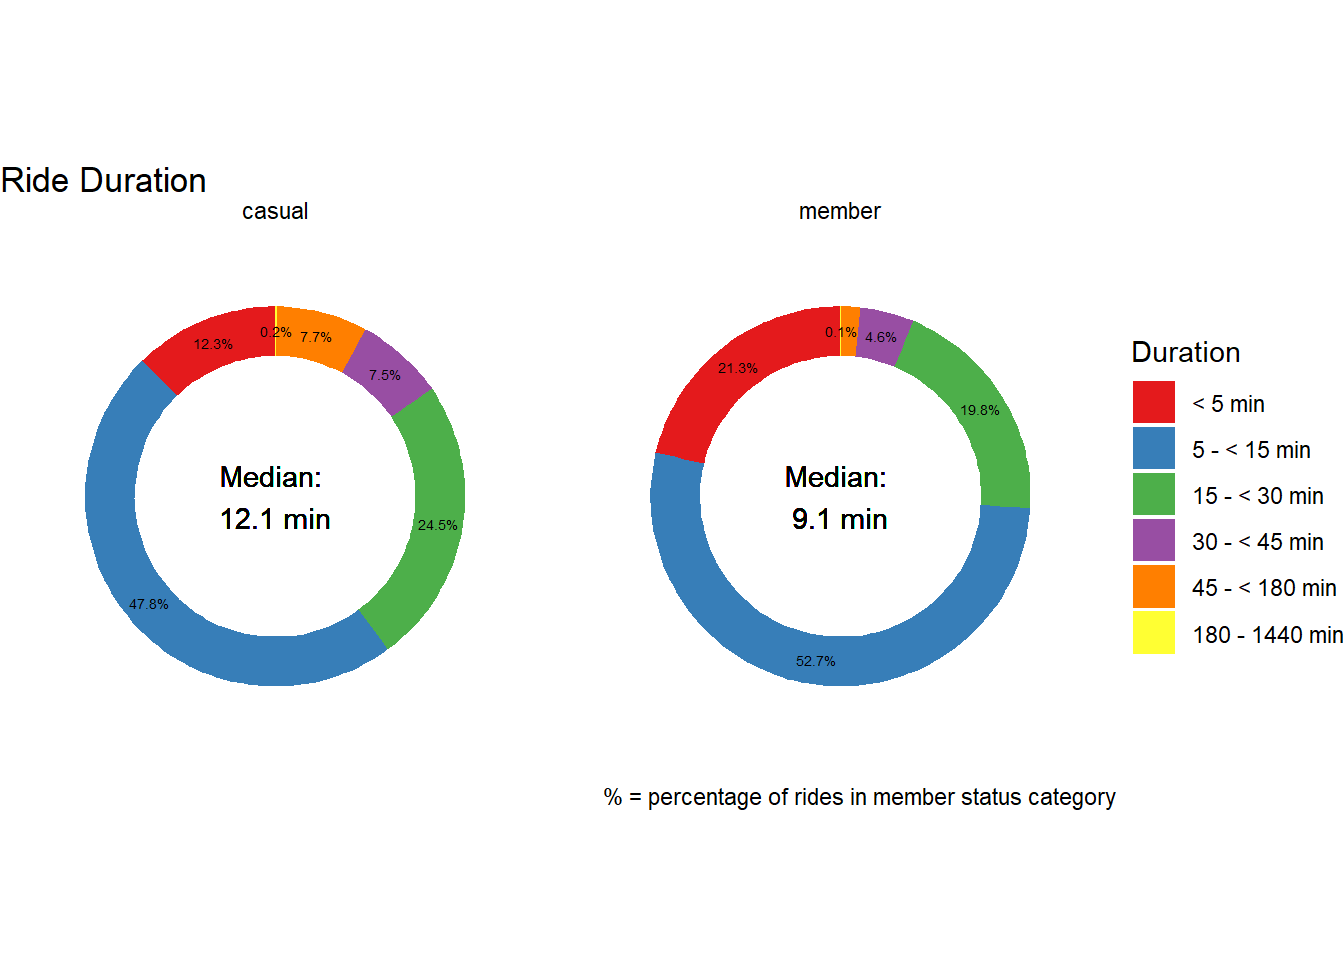
Initial Observations
- Rides are typically a bit shorter in duration for members
Analysis Summary
- Differences in usage for casual and member riders may be driven by different use cases for each group
- Member rides are relatively shorter in duration and occur more during weekday morning and evening rush hours, implying commute use
- Casual rides are more common on weekends, and start and end at the same station more often, implying leisure and errand usage
- Community-level features may influence willingness to subscribe
- Member ride proportion is correlated with higher community population density
- Member riders may represent a hardier type of bicyclist
- Higher proportion of member rides compared to casual rides in the winter months
- Greater number of rides using manual bicycles for members
Recommendations
Our analysis informs a number of possibilities for targeting. But feasibility may depend on what information from casual users is available to us. Variations in strategy are offered given the caveats of available information.
Strategy #1
Time Digital Marketing Campaigns around Peak Season for Casual Riders
- Key finding: Rides are more common in summer, peaking in late July for both casual and member riders
- Users are probably more likely to consider subscribing if they are using the service often
- Proposed Action: Aggressively promote membership slightly before peak ridership period, enticing casual riders who are already using the service and who will see high utility a year later when it’s time to renew
- Not necessary to specifically target casual users, but can do so through direct e-mail or other digital marketing given availability of contact information for casual riders
Strategy #2
Target Digital Marketing at Commuters & Likely Commuters
- Key finding: Current subscribers make a greater proportion of their rides during weekdays, and specifically traffic rush hours, than casual riders
- A large proportion of member rides are likely being used for commuting purposes
- Proposed Action: Target casual users who often make two rides per day with an extended time period in between, implying commute usage
- Contingent on availability of person-linked rider data and email contact information or direct app messaging
- Alternative Action: Employ channels used by possible commuters (e.g. L-train website ads) and prospective commuters (e.g. job seeking websites) to market subscriptions
- Possible regardless of comprehensiveness of individual casual user data
Strategy #3
Target Digital Marketing at Casual Users in High Population Density Communities
- Key finding: Higher density communities show a greater proportion of member rides
- People in these communities may have more difficulty storing personal vehicles (automobile or bike) and parking in dense neighborhoods due to living situations
- Amenities may be more quickly reachable by bike, increasing bike share attractiveness
- Proposed Action: Target casual riders living in high density communities for digital communications and possible promotions to incentivize subscriptions
- Contingent on having home information from casual users through app signup or provided by credit card companies for swipe-only kiosk rentals
- Alternative Action: Place digital ads geofenced to denser communities with higher casual ridership promoting annual subscriptions
Future Steps
- Improve on the ride-level analysis
- Explore methods to exclude non-Chicago residents (e.g. tourists) who are unlikely to subscribe from analysis
- Re-assess ride time and distance in the context of the tiered time payment schedule and the Bike Angels program which incentivizes members moving bikes from more crowded to less crowded stations
- Determine the influence of traffic density on ridership
- Evaluate the influence of bike usage by school-age children on the number of rides, and how that might influence findings
- Ascertain the role of weather on rider mix
- Account for rides related to sporting and other large community events
- Examine how trends related to COVID and office return policies might impact these numbers
- Create a model predicting casual vs. annual subscription riders on a person-level using internal individual-level demographics in addition to ride data, for the purposes of targeting likely subscribers who aren’t yet subscribed