With Arsenal having finally thrown off the unfortunate spectre of being premier “bottlers” to hoist the English Premier League trophy, the 2025-26 English league season has come to a close. As a sports data consumer, it also means that there’s another full season of data to put to work in statistical models. I’ve previously written about xG, the expected goals metric, in football/soccer, outlining a number of inputs that go into popular models. Typically, these are centered around the position and circumstances of the shot itself.
What I haven’t widely seen is a version where the shooter is taken into account. So with all other things being equal, a shot from prime Leo Messi would have the same value as one from a goalkeeper with poor shooting technique making a desperation shot at the end of a match. A header from someone with height and/or jumping reach to corral and direct aerial balls, say 6’7” Peter Crouch or prime Cristiano Ronaldo, would have the same value as one from a shorter player who might be lucky just to get a stray hair on the same ball. The true outcomes would most likely tell us a different story.
Given that, I wanted to construct my own metric, at least on a small scale, that would incorporate some characteristics around the shooting player skill at the point of the shot to hopefully enhance the model’s predictive ability and provide further practical value. Admittedly, in so doing, it would differ in the interpretations and applications made around xG totals for players or teams. Typically, xG’s focus on the quality of shooting chances for a team or player allows for its use as a metric of offensive potency (or defensive charity, depending on the side being analyzed). Furthermore, you can indirectly assess whether players (or a team as a whole) are better at finishing those chances by examining whether their actual goal scoring falls over or under what would be “expected” from a typical player.
xG totals from a shot-taker-adjusted model would aim to better credit teams that can scheme up their best shooters to take shots that align with best their skills, or conversely, give better accounting to good defensive teams that are able to neutralize the most dangerous opposing shooters and force more awkward, poorer quality shots. Teams scoring noticeably above these expected totals might point to their creating more advantageous circumstances around the shot and shot-taker beyond what has been accounted for in conventional xG, such as consistently creating more open spaces through offensive scheme and positioning, or a consistently clinical placement of passes by teammates. Over- or under-performance by a player on this metric should be an indicator of whether they are exceeding or falling short of their previous performance as a finisher, not other players in general as with conventional xG. This could highlight players on the rise or on the decline. As with conventional xG, we should be able to pinpoint specifics by looking at these totals stratified by specific factors. Below, I run through the exercise and explore the usefulness of the resulting model in these contexts.
Primary Aim
- Generate a novel xG model incorporating both shot situation and shot-taker characteristics to improve predictive ability and create novel facets of understanding around players and teams.
Data & Model Building
The training for this machine-learning model was performed on 5 years of English Premier League shot data and tested using the 2025-26 season’s data, with own goals removed. Publicly available data was limited, so most of the predictors focused on aspects of the shot itself (e.g. location, body part, different open play/dead ball situations and preceding event) and broader game state variables around each shot. As previously mentioned, I did want to add information related to the shooter that might directly affect or otherwise interact with the known shot characteristics (e.g. footedness, height, a crude assessment of shot conversion efficiency based on prior seasons) to inform the model further.
Also, in an effort to enhance prediction accuracy, I split the exercise into two separate sets, fitting models for shots for non-penalty shots by themselves, since their fundamental differences from penalty shots likely warranted separate predictor sets. I initially tried to fit a simpler model for penalty shots, but the low number and substantial randomness ultimately made it difficult to create any with appreciable predictive power, and it ultimately muddied the interpretations of the model outputs when aggregated to larger entities. As a result, I just set the probability to a constant based on the training set conversion rate (~81.4%), similar to other xG models.
For the non-penalty shots, a number of models from different families (GLM, tree-based, gradient-boosted trees, and deep learning) were evaluated. These models were evaluated using 10-fold cross-validation with class-balancing to deal with goals being a rare outcome. Final models were chosen based on which best minimized mean log loss over the CV folds, then compared against the test set to check for possible overfitting. The final model choice was designated xG with shot-taker parameters (xG-wst). For comparison, I also created a version built on just situational parameters of the same training data, called xG-situational (xG-sit).
Results/Discussion
Descriptive Statistics
The shot data for the new season was composed of 9483 shots, netting goals at an 11% rate. 30% of shots came from outside the penalty box, and were almost perfectly split (50%) between the left and right halves of the pitch. Slightly less than 1% of the shots were penalty shots. Shots were taken with a dominant foot 64% of the time, the non-dominant foot 17% of the time, the head 19% of the time, and with some other body part for the very miniscule remainder. And overall, I didn’t notice dramatic differences from the 2023 shot data described in my initial xG exploration post, so I’ll focus more on the model output.
Model Evaluation
On a shot-level basis, the model built on shot charactertistics alone (xG-sit) reassuringly yielded metrics fairly similar to the Understat and Opta metrics from 2023 that were previously examined (mean log loss - Understat (2023): 0.272, Opta (2023): 0.273, xG-sit (2025): 0.278), indicating that new xG model was at least functioning in the same neighborhood fitwise as the other location/situation-driven models I had examined from a prior season. Adding shot-taker characteristics to the model (xG-wst) yielded slight improvements in fit (mean log lossxG-wst = 0.277).
While I didn’t have access to shot-level xG data from the external models, Opta and Understat, for 2025 for direct comparison, Opta and Understat both publicly report season-level xG totals that I could compare on a team-by-team basis. When model-estimated team goal totals were mapped to actual goal counts for each club (minus own goals), model fits for estimated team totals actually fit better for my newer models compared to those for Understat and Opta (Table 1). Correlations with actual goal totals were strong for all models, withOpta counts recorded the lowest correlation in this specific instance (r = 0.85), while Understat (r = 0.89) and my new models posted somewhat higher figures (rxG-sit = 0.88; rxG-wst = 0.90). The estimated goal totals produced from xG-sit and xG-wst were still highly correlated with both external model predictions (r > 0.90 for both).
Table 1. RMSE by Model for Club Goal Totals in the English Premier League, 2025-26
| Model | Goals Scored | Goals Against | Goal Difference |
|---|---|---|---|
| Understat | 9.48 | 9.21 | 7.12 |
| Opta | 6.39 | 5.44 | 7.54 |
| xG-sit | 5.86 | 5.12 | 6.62 |
| xG-wst | 5.05 | 4.86 | 6.48 |
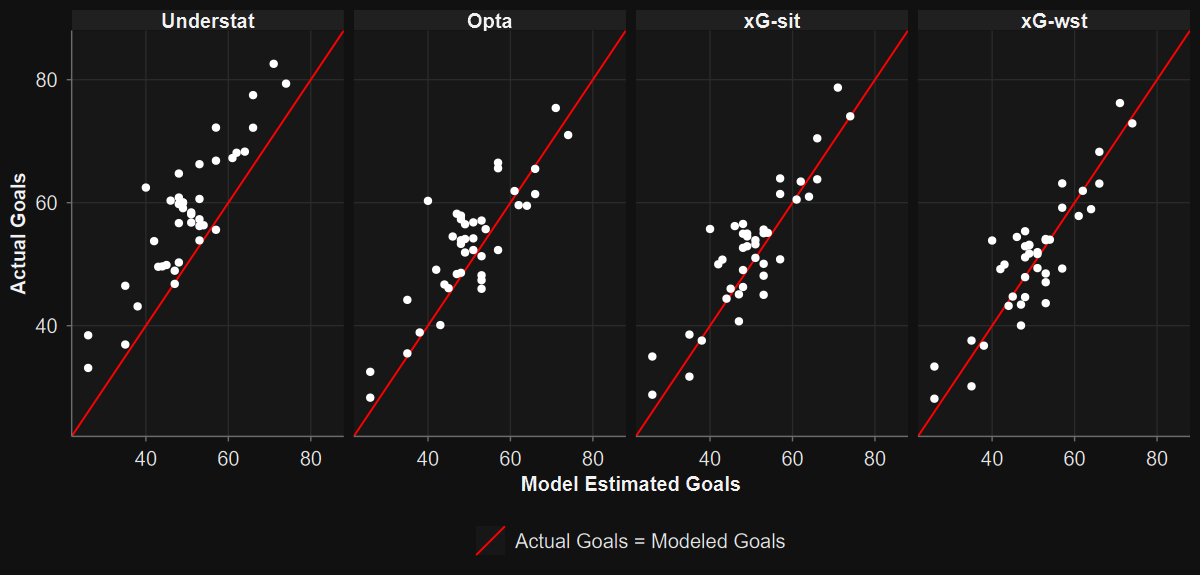
The team aggregations of xG can also help visualize the shot-level model biases (Figure 1). With the large caveat that this is only one season, Opta’s model and my models have a fair number of teams above and below zero over the three metrics, and appear to be better calibrated for the Premier League. The Understat model overestimates the total goals (scored and conceded) for nearly all teams in the EPL. This is a complication for those looking to use under- and over-performance on xG to judge the quality of a team or player compared to the average, or the likelihood of their performance regression. But I assume that, depending on the purpose, a simple conversion to ranking or centering would preserve its usefulness for discussion purposes.
Figure 1. Relationships between Club-Level Goals & Aggregated xG Totals for Understat, Opta, xG-sit and xG-wst for the English Premier League, 2025-26.
For predicted goals scored, my models has the top four as Manchester City, Arsenal, Chelsea, and Manchester United as did Understat’s xG table. Opta’s was only slightly different, with Chelsea ahead of Arsenal (Table 2). As such, all were a bit caught off guard by the Chelsea’s poor actual goal total, but otherwise did a good job with the top of the table (Manchester City, Arsenal, Manchester United (T-2), Liverpool). The bottom three for scoring in both my models were Burnley, Wolves, and Sunderland, mirroring Opta’s and Understat’s tables. Wolves ended up being the worst in goals scored in actuality, but again the models did at name the 3 qualifiers. For predicted goals conceded, my models and Opta’s model concurred for the 3 teams with the least xG (Arsenal, Manchester City, Liverpool), getting the first 2 correct. The three predicted to have had the most conceded goals (Burnley, West Ham, Wolves) coincided with the actual lowest goal scorers, albeit with a slightly different order.
Table 2. Actual and Predicted Goal Totals from Understat, Opta, xG-sit, and xG-wst for the English Premier League, 2025-26
Application: Club-Level xG Over- and Under-Performance
As stated before, a typical use for club-level xG estimates over the course of a season is to assess that club’s shooting efficiency compared to what we’d expect from a more average team. But while some standout performances one way or the other will often regress back to a more average state, others are standouts for a reason. With that in consideration, I hope you’ll indulge me as I start an examination of the outliers as a sort of logic check of the new models.
Despite finishing in the bottom half of goals scored, Tottenham was the biggest overperformer according to xG-wst (7.0 GOE), followed by Aston Villa (5.9 GOE), Burnley (4.9 GOE), and Nottingham Forest (3.6 GOE) (Table 3). Opta diverged a bit, rating Sunderland, Aston Villa, Manchester City, and Burnley its top four, and actually labeling Spurs a slight underperformer. Digging into Tottenham’s numbers in the , a large portion of overperformance lies in shots coming from corners (7.9 GOE), which persists at least so some degree in Opta’s reported tally of set piece goals vs xG (4.2 GOE). The overperformance is very similar for xG-wst and xG-sit model, so it likely isn’t the quality of the players getting the shots alone. It could be that Tottenham are sending more numbers into the box than the average team, or that they’re running better designed plays that free up there shooters much better than most. While I haven’t found a good post-season breakdown of the specifics, a history of Thomas Frank orchestrating those types of corners, and their use and success likely have stayed beyond his tenure. As for the difference with Opta, it would be interesting to see other splits to see where the models might be differing.
Table 3. Differences between Actual Goals and Expected Goals from Understat, Opta, xG-sit, and xG-wst for the English Premier League, 2025-26
My shot-taker-adjusted model graded Crystal Palace the biggest underperformer (13.8 goals under expected), with Opta’s model being even more underwhelmed (18.2 goals less than expected by Opta) (Table 3). While the model agreement gives some reassurance, the enormous prediction-reality gap begs for an explanation. The most eye-catching split was that most unrealized xG was from home games (12.3 less goals than predicted), easily the largest home discrepancy in the league, It didn’t seem to be easily explainable by poorer finishing against opponents’ negative play, as the deficiency persisted regardless of score, being most obvious in tied matches. Some arguments point to the club was struggling to break down low blocks at home, though they didn’t seem to be facing them often, at least for the first half of the season. Other suggestions, such as greater anxiety in front of home crowds or lack of synergy due to injuries and international play absences might play a factor, are more difficult to corroborate with the data typically available.
On the other end of the pitch, Liverpool is the biggest outlier in terms of defensive performance differing from expected, conceding 53 goals, 9.3 goals more than xG-wst would suggest (Table 3). This is also the biggest underprediction of goals conceded for Opta which predicted 5.6 less, though that model does have larger overpredictions. Much of this appears to come from home matches and when they are ahead or tied, and late in matches. A pervasive storyline for them this season is late game concessions, and journalists have noted that 40% of Liverpool’s chances conceded come from transition, so part of this could be that Liverpool concede more shots with less defenders back than most, which yielded more goals than expected given the shot position alone. This might even their conceding the 2nd most goals over xG on shots outside the penalty box. A [lack of rotation]((https://www.goal.com/en-us/news/liverpool-s-collapse-tactical-misfit-or-intensity-drop/bltf048782e743141df) leaves the on pitch players more tired and more prone to lapses than you’d typically see, especially when opposing teams ramp up their aggressiveness to chase a result. But according to xG-wts, Liverpool has given up more goals over expected via set pieces in one-third of the shot attempts, which may speak to less organization on the back end, or a lack of physicality when defending. Ultimately, this seems like an issue that doesn’t have one or two overarching explanations.
My models credit Sunderland with the biggest difference between goals against and expected goals against (xG-wst: 8.4 under expected). This is markedly different from the Opta prediction (4.7 goals over expected). This better-than-expected defensive performance (according to my model) seems to come almost entirely from non-headed shots taken inside the box (25 goals allowed compared to 34.6 expected). They occurred mostly out of instances where Sunderland was tied or ahead by a goal, though that is when most of their opponents’ shots are taken. Research indicated that Sunderland is on the extreme end of usage of a low block with defenders close to goal. My instincts were that more shots taken against them are likely to be blocked. Indeed, that seemed to be the case, with Sunderland tops in blocked shots and netting the 4th highest block shot percentage in the league. So my new model appears useful for parsing out true outliers in strategic play. However, the gap between our estimate and Opta’s, which has the benefit of defender positioning among its inputs, may indicate that the xG-wst model may give Sunderland more credit on a shot-to-shot basis than is actually due.
Club Totals: Shot Situation vs. Situation + Shot-Taker Adjustment
But as I stated in the introduction, one of the more unique applications of a shooter-adjusted xG is the ability to better recognize teams who are manufacturing chances for their best shot-takers to use their best abilities. So, if a team was creating chance for their best shooters in preferred situations, direct comparisons predictions with a situation-specific xG should help isolate that distinction. In this specific execution with xG-wst, adding a crude assessment of shooting ability improved the fit a bit for the 25-26 data. xG increased for 44% of the non-penalty shots and decreased for the other 56%. Aggregated, it ended up decreasing all predicted goal totals. Team differences between the shooter-adjusted model and the base model ranged from -2.7 to -0.7 for goals scored and -2.3 to -0.6 for goals against. I did notice that, especially for the outliers, the number of shots was heavily linked to model differences for each team, so I focused on relative change for this exercise.
Burnley’s xG drops the most, on a proportional basis at least, when the shot-taker is also included in the model, while Manchester United’s xG fared the best. For Burnley, it considered the squad’s shot-weighted finishing to be the worst given what it new about the players prior to the 2025-26 season. Among players with double digit shots, it noticeably downgraded the xG from shots by Anthony and Ugochukwu, especially ones off their weak foot. Burnley also shot the highest percentage of its shots off the weak foot, hurting its xG further in the model’s eyes. For Manchester United, it considered the shot-shooter combinations to be fourth best in the League. Interestingly, the model thought more highly of their shots out fo any dead-ball situation, at least in part because players like Casemiro, Maguire, and de Ligt were known to be good getting headers on goal.
On the defensive side, Brighton is the team the new model is least generous towards. Examining their kicked shots allowed inside the penalty box, they were the worst in shooting quality allowed, contributing to their high xG conceded. Conversely, the newer shottaker-adjusted model improved Manchester United’s position the most, as they had the largest proportional drop in xG. This could be connected to their relatively low finishing quality allowed, 5th best in the league.
Shooter-Level Estimates
I also was curious about top shooters in expected goals as predicted by my new xG-wst model, in part to get an idea of how consistent the smaller aggregations would be with the external models. Those were Haaland, Thiago, Calvert-Lewin, Watkins, and Pedro. Somewhat reassuringly, that matches the order for Opta, while Understat differed only in putting Mateta just ahead of Pedro. All failed to perfectly predict the order of the true top 5 scoring leaders: Haaland, Thiago, Semenyo, Watkins, and Pedro.
Semenyo’s finishing quality surprised all the models, with Understat placing him 9th in total xG, and both Opta (+5.9 goals over expected (GOE)) and my xG-wst models putting him 13th (+6.4 GOE). Semenyo’s case was unique, as this success covered two clubs, so it wasn’t so quickly dismissed by assigning credit to his club’s offensive system or teammates. And my xG-wst model was applied with the notion fewer than 10 players had better short-range shot conversion ability than he did, so my model wasn’t just grossly underestimating his ability. Digging deeper, the bulk of his overperformance came from two sources: converting 3 of his low xG, long distance shots (+2.1 GOE), or converting passes received inside the 18-yard box (+2.2 GOE). A video review of his goals revealed that most shots quickly were taken, one-timers or after a first touch.
Notably, he placed highest in the league in weak foot shot percentage, demonstrating extreme comfort with either foot. This is something he’s well known for, this gives him more options to find clearer shot paths to the goal when passed to, such as either taking one timers on one foot or letting it cross the body to take it on the other if that was the clearer option. So while some adjustment for finishing skill is predicted in the xG-wst model, the high quality coming from his off-footed shot in particular would not be well-accounted for, but that could be mitigated in future iterations.
Table 4. Actual and Predicted Goals for Largest Overperformers Compared to xG-wst, 2025-26
| Rank | Name | Club | Goals Scored | xG (situational) | xG (with shot-taker) | xG (Opta) |
|---|---|---|---|---|---|---|
| 1 | Morgan Gibbs-White | Nottingham Forest | 15 | 9.9 | 9.6 | 10.8 |
| 2 | Junior Kroupi | Bournemouth | 13 | 8.5 | 8.5 | 8.4 |
| 3 | Casemiro | Manchester United | 9 | 4.7 | 4.7 | 5.5 |
| Opta xG via PremierLeague.com | ||||||
In the hopes of identifying other underrated shooters, I looked for the highest overperformers based on absolute differences between actual goals and shooter-adjusted xG. Morgan Gibbs-White tops my list, trailed by Eli Kroupi and Casemiro. These figures still don’t differ too much from Opta’s despite their not having the added shooting parameters, though their list was topped by Semenyo, with Kroupi second and Harry Wilson third. Gibbs-White and Casemiro were 4th and 6th on their list. Most are known quantities, with Kroupi being the youngest but probably drawing the most attention as evidenced by his skyrocketing transfer valuation. But 5th in the rankings is Osula from Newcastle, who didn’t get as many opportunities, but converted well (7 goals scored on 3.2 xG-wst/4.3 xG-Opta). This finishing efficiency from a young player could warrant a close eye for those looking for quality in front of goal, and we’ll probably get more of a look at him with Anthony Gordon moving on.
Table 5. Actual and Predicted Goals for Largest Underperformers Compared to xG-wst, 2025-26
| Rank | Name | Club | Goals Scored | xG (situational) | xG (with shot-taker) | xG (Opta) |
|---|---|---|---|---|---|---|
| 180 | David Brooks | Bournemouth | 1 | 5.5 | 5.2 | 5.8 |
| 179 | Liam Delap | Chelsea | 1 | 5.2 | 5.1 | 4.5 |
| 178 | Evanilson | Bournemouth | 6 | 10.5 | 10.0 | 10.6 |
| Opta xG via PremierLeague.com | ||||||
On the other end, players scoring most under their xG-wst include two of Kroupi’s Bournemouth mates in Brooks and Evanilson, both sandwiching Chelsea’s Delap to create a bottom three producing around 4 goals under expected. Most of the players low on this list are relatively young, so there’s hope that their scoring efficiency will improve. But if there are factors which might be contributing to their shooting inadequacies, such as injuries, they should be monitored closely.
Closing Remarks
For a first crack at an expected goals framework using just 5 years and 50,000 observations for training, when compared to the millions of entries used to train Opta and over 100,000 used to train Understat, the resulting product was fairly respectable. I don’t think I saw anything in the extreme observations that would suggest that it was veering off in inexplicable ways. I would reason that, compared to the external models, it does take advantage of specificity of its training when being applied to predict EPL data, as it could be more attuned to the general tactical strategies, player profiles, and general style of play. Others models were meant for broader applications, and while I assume some level of league-specific adjustment could be implemented, whether it is in place or is a need of refinement is a question.
The shooter-adjustment, which leveraged additional info like shooter height and historical shot conversion efficiency in prior seasons, was mildly helpful in goal likelihood. The relatively small impact compared to shot-situation and game state factors could be related to the difficulty in distinguishing between players’ finishing skill, especially for those who rarely shoot. That quality could also be variable and ephemeral, impacted over the course of the season by the injuries, fatigue, player confidence, or how well those around him are playing. Despite the complicated nature of even this single component of shooting, there still may be avenues of tangible improvement to produce a more robust overall model.
Despite the aforementioned challenges, the xG-wst model shows promise as a diagnostic tool, with its detection of team and player performance outliers mapping to individual and tactical realities on the pitch. Player overperformance beyond shottaker-adjusted model expectation could help identify players whose shooting might have improved beyond their pre-existing labels. Ultimately, it demonstrates its usefulness in generating actionable insights comparable to models that apply full 22-player tracking data. With further exploration around its interpretation, it should serve as a good jumping off point for developing more refined models.