
Soccer is the most popular sport in the world, so it’s no surprise that analytics to better understand the game are of great interest to the public. Expected goals (xG)—the estimated probability of attempted shots being scored based on characteristics like distance and situational context—is one of the most widely recognized metrics in soccer analytics. When summed across a match, xG can provide a better evaluation of a team’s offensive performance than counting stats like goals (which are typically rare events) and shots (which can vary widely in quality and mislead regarding the actual offensive threat a team presents). As a result, xG has become a mainstay in game recaps to give fans a richer picture of how a match played out. Aggregations over larger periods can often help teams assess the effectiveness of certain formations, lineups, players, or strategies in both generating scoring opportunities or preventing them. They can also improve the ability of sports media to provide more objective analyses and bettors to predict outcomes of future matchups.
Given the demand and the many sports statistics providers in existence, various xG models are available. Naturally, one would be curious as to how well they perform, both overall and in comparison with each other. As a thought exercise, and to shed some light on how analysts might attack a question and the data around it, I’ll look at xG figures reported by two sites popular with the soccer analytics community.
Data
The first batch comes from Understat.com. In their model, they report using more than 10 different parameters, applying them in neural network prediction algorithms over 100,000 shots to estimate goal probability from a shot. Beyond that, it is a bit of a black box to me, as I haven’t encountered any specific official documentation mentioning any parameters it employs. However, the website does show shot location, and reports shot context factors like minute and situation, whether the shot was assisted, and body part used to shoot, so it wouldn’t be surprising if any or all of those variables were included in their model.
The second batch of figures are output from a model by Opta, accessible using fbref.com. Football Reference report including 35 different parameters: shot location, possession context, clarity and pressure, goalie location, and among other parameters. However, most of these aren’t immediately available from the dataset I’m accessing. As a result, any contextual comparisons will likely be made using the ones provided for the Understat model.
From this shot data accessed through R package worldfootballR, I’ll focus specifically on the most recent full English Premier League season, 2023-2024, matching the shots from each dataset using information on date, team, shooter, and minute of shot. The EPL may be just a slice of the broader soccer universe these algorithms are trained for, but it is an important one. That slice makes more in revenue than any other nation’s top league, giving the Premier League considerable pulling and purchasing power regarding players and personnel, and may result in a higher quality of play than other leagues if they can adequately identify talent. So while the models might not be optimized for this league specifically, better predictions in this domain would benefit a number of stakeholders within and adjacent to the sport who rely on analytics to assess and forecast team strength.
Exploration Aims:
Evaluate the two xG models against the recent EPL goal data and compare them side-by-side
Assess which factors might be important in driving xG prediction in each model
While I intend this to be a informal look, it will hopefully still shed some light on these figures that are so often invoked.
Descriptive Statistics/Comparisons
For 2023, Understat recorded 10,472 shots while Opta provided data on 10,489 shots. Despite the relative shot similarity, the two datasets have some differences in the shots that are reported. For instance, differences in name of shooter and minute of shot were fairly common, requiring multiple stages for the data linkage. But the combined dataset yielded 10,465 shots with data from each. Still, that data were not completely in sync. After rounding, recorded shot distances differed by more than 2m for 14%. Less common were differences in recorded body part of shot (25), and 1 goal was miscoded as a missed shot in Understat, with more differences for shot subclassification.
For anyone new to xG as a concept, the first thought would probably be to test how well they actually predict goals. Given that each model is predicting a goal whenever the xG is greater than 0.5, we use our data to create a confusion matrix for each model output to visualize and assess how often the models predict actual goals and misses, and how often they are incorrect.
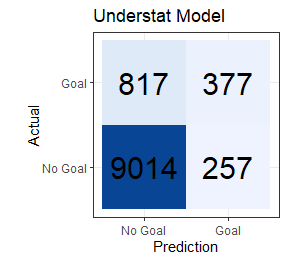
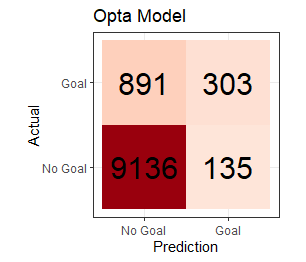
Figures. Confusion Matrices for Understat (left) and Opta xG models, EPL 2023
Looking specifically at the accuracy (% of correct predictions), the more-parameterized Opta model holds a slight edge (accuracy = 90.2%) over the simpler Understat model (accuracy = 89.7%). While that overall figure sounds pretty impressive, it’s important to realize that the data are quite imbalanced, since most shots don’t result in goals. A model that would naively predict no goals to be scored would be almost 89% accurate.
There are other metrics to choose from which might be better for this type of imbalanced data, or depending on the importance of true findings and error rates. A simple example of one that might be more helpful is balanced accuracy, where an average of the sensitivity (probability of predicting the goal when one occurs; True Positives / (True Positives + False Negatives ) and specificity (probability of predicting the missed shot when one occurs; True Negatives / True Negatives + False Positives ). Given this criteria, the less parameterized Understat model (64.4%) is actually slightly outperforming the Opta model (61.9%).
However, xG is not typically optimized to make the most correct goal/no goal predictions, but rather to most closely estimate the probability of each shot netting a score. That ends up being a noticeably different proposition. To see how each model is performing in that domain, other metrics are typically employed. One is the mean log loss, which is built around the differences between the outcome (0 for no goal; 1 for goal) and the probability of scoring that a model produces. A similar metric, the Brier score, looks at the square of those differences to ultimately produce a criterion that is a little more lenient on occasional high confidence error in either direction by aiming for smaller squared differences.
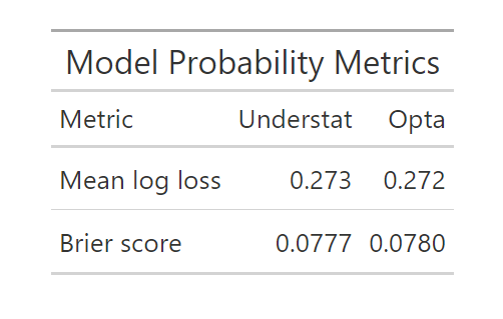
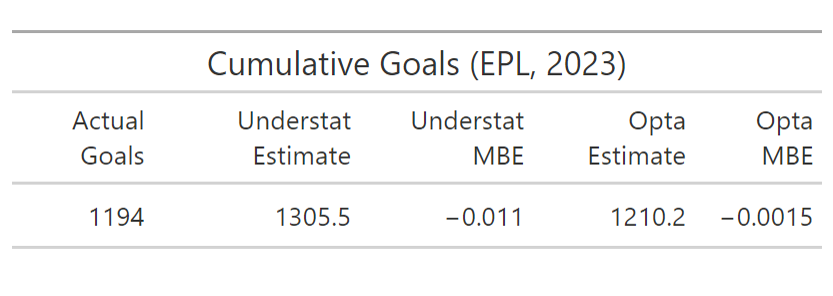
Tables. xG Probability Model Metrics (left) and Actual vs. Cumulative Probability Predictions (right) for Understat and Opta Models, EPL 2023
From the first table, the two models seem to produce quite similar errors using the common probability metrics, with each performing better on one. But when we look at the goals aggregated over the entire season, we see that the the Opta model comes a fair bit closer than the Understat model. From this, it’s important to note that the model metrics are based on absolute value and squared errors and don’t incorporate the directionality of that error. The high number of goals predicted by the Understat model compared to Opta and actual goals may indicate a small systematic bias towards overprediction. Those differences are worth a deeper look.
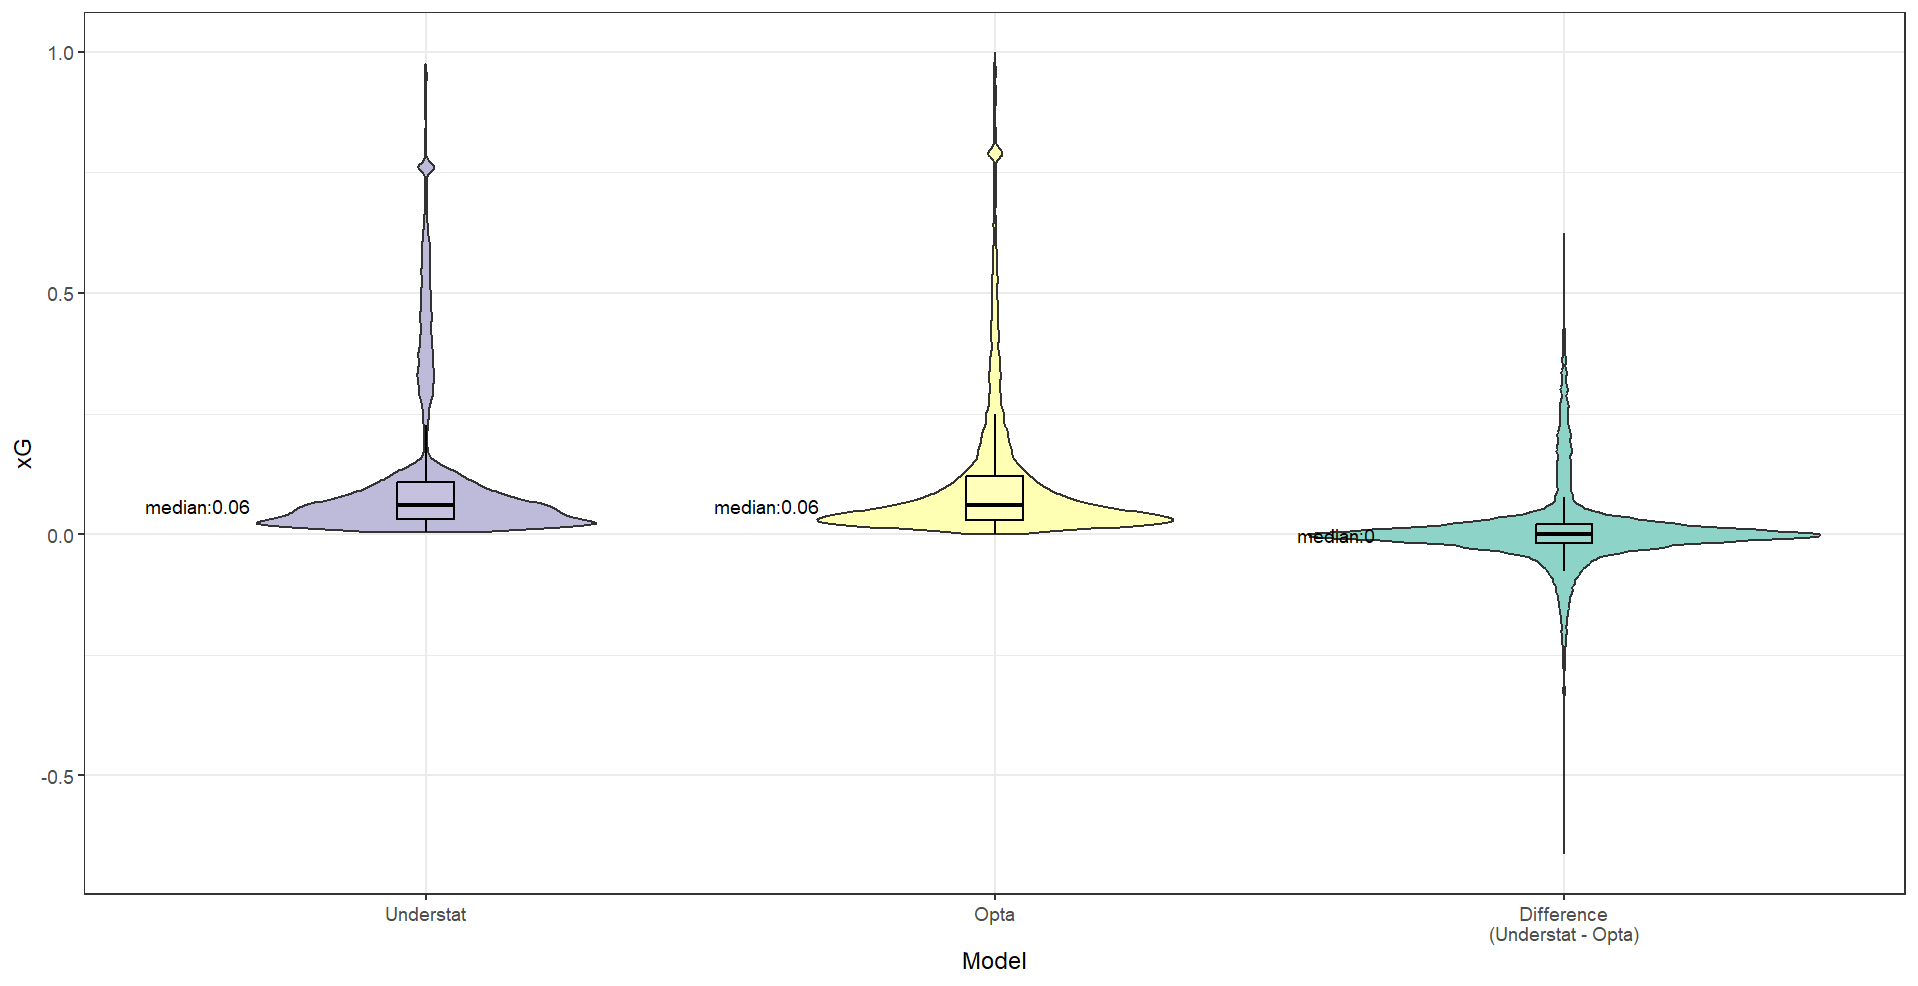
Figures. xG Value Distribution (left) and Difference Distribution (right) Violin Plots for Understat and Opta Models, EPL, 2023
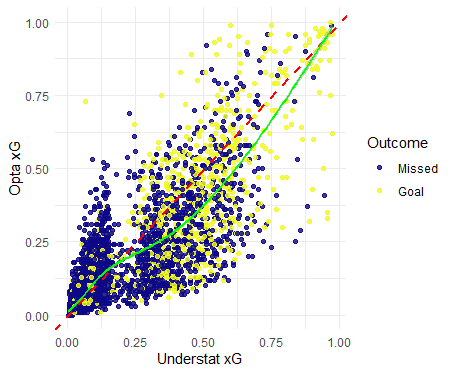
Figures. xG Value Comparison Between Understat and Opta Models, EPL, 2023
One crucial observation is that there is a small cluster of shot predictions exceeding 0.75 xG for each model. Those map to penalty shots, which have a predictably high conversion rate. Setting aside those relatively rare circumstances, these two figures show that most shots have a quite low scoring probability in both models. But while Opta’s model maintains a consistently decreasing number of shots with increasing probability, the Understat model seems to have two more distinct probability clusters. It appears that the Understat model is more reluctant to assign probabilities around the 0.20 range, instead placing most shots above or below that line. Above that point, Understat predictions trend toward being higher, while the below that point, Opta estimates skew towards slightly larger values. My initial speculation is that there might be a major categorical or binary variable, or perhaps a simple combination of variables, that signals a large jump in the goal probability for the less parameterized Understat model. The Opta model may apply its greater number of parameters to further differentiate between shots and provide a more nuanced estimate.
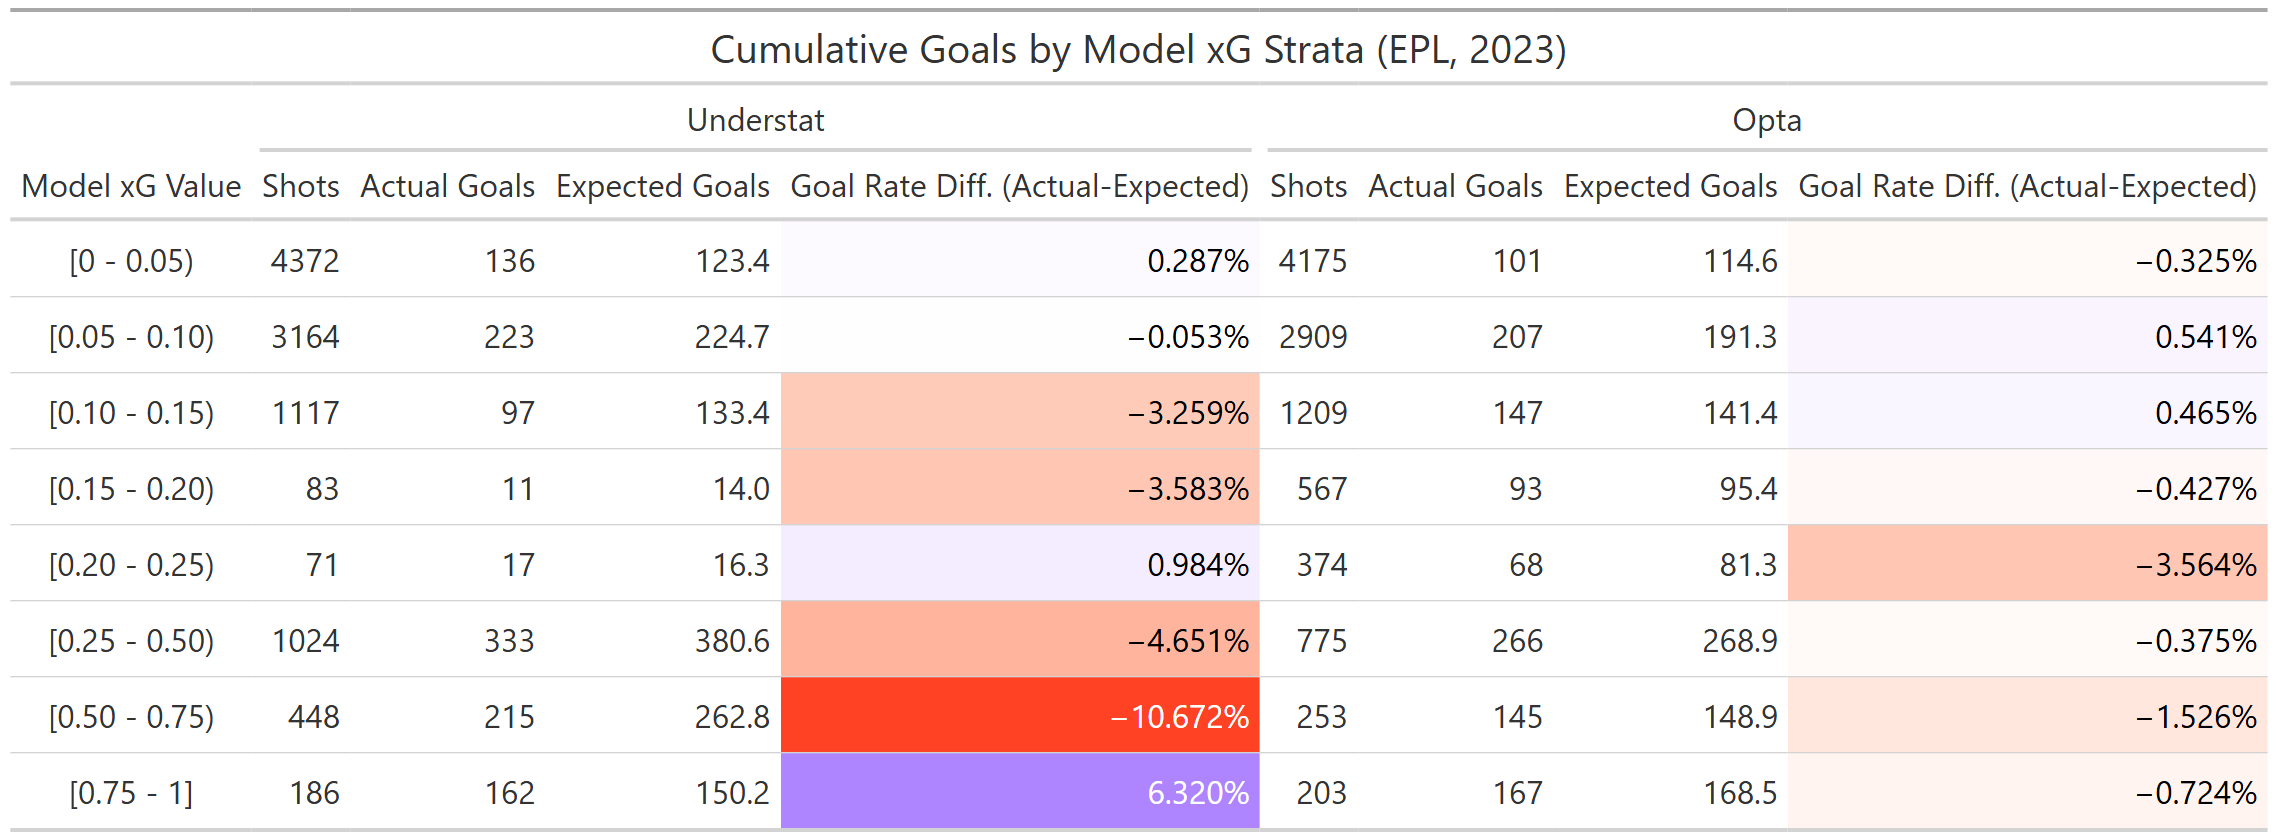
How does that affect model prediction ability for lower versus higher probability shots? This table shows that, for the 2023 Premier League at least, the goal chance overprediction appears to concentrate at higher probabilities, excluding the highest category encompassing penalty shots and one of the regions with sparse predictions discussed earlier. For Opta, bias does not seem to be strongly linked to estimated probability magnitude and generally performed better in each category.
Possible Predictors
To visualize more specific patterns in xG, and perhaps find a suspected parameter strongly influencing the spacing in xG prediction for Understat, xG was plotted for a number of subgroups. The same was done for a couple of continuous predictors.
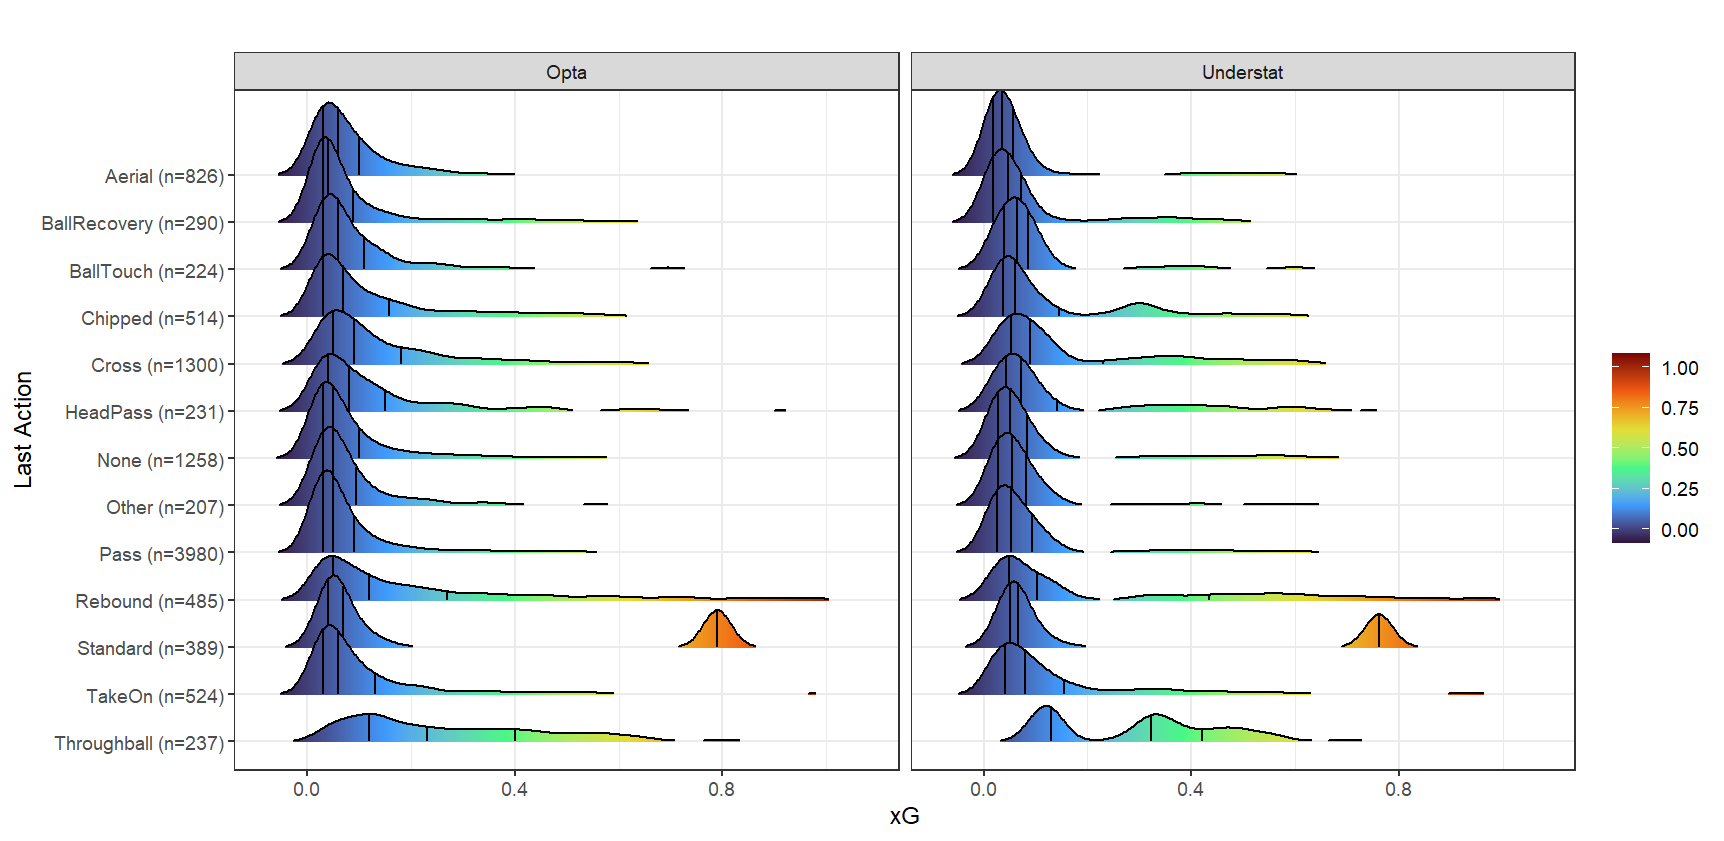
Median xG did not differ substantially by situation, with the highest coming from open play for both models. Of the 26 categories of actions were recorded immediately prior to each shot, some did seem to connect to higher xG shots. For example, the highest xGs for that predictor were from throughballs (median xG = 0.32, n=237) and rebounds (median xG = 0.10, n=485), while xG from the most common category, “pass” (xG = 0.05, n=3980) were generally lower.
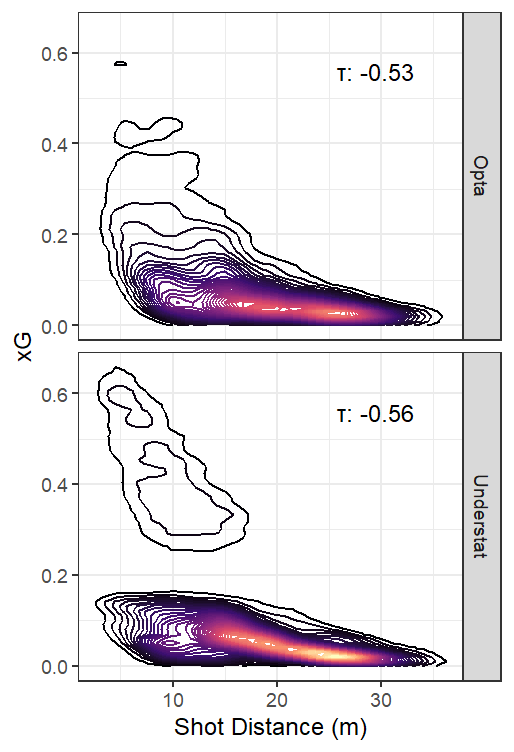
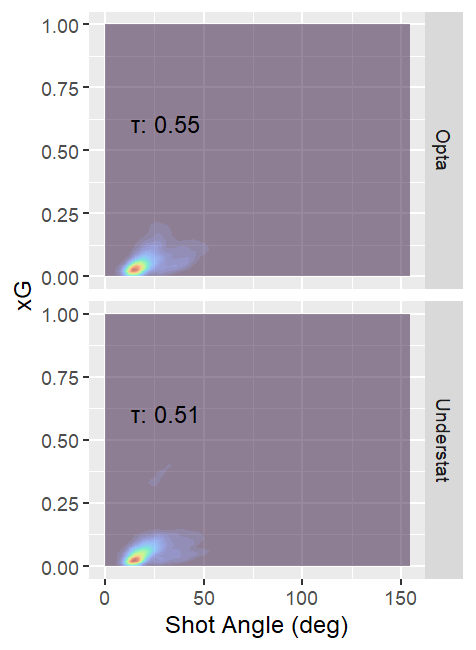
Figures. xG Prediction Contour Plots for Shot Distance (left) and Shot Angle (right) for Understat and Opta Models
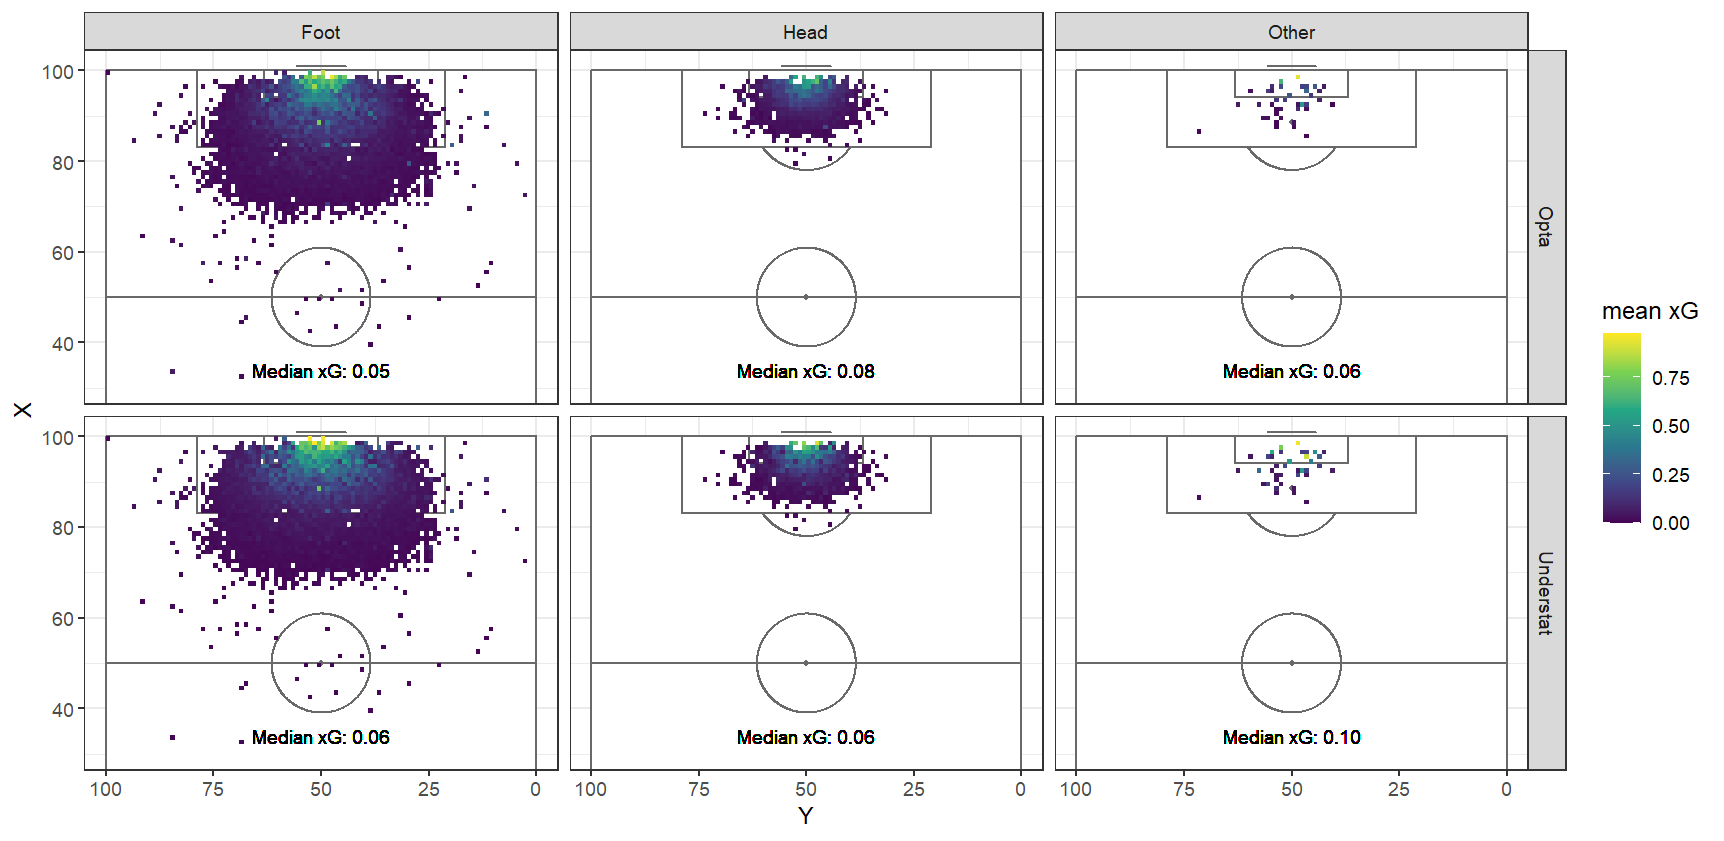
Predictions from both models were understandably negatively correlated with shot distance, and positively correlated with shot angle. Shooting body part showed a little more separation in median xG for Understat, but that was strongly related to differences in shot distance. When looking at specific regions closer to goal, xG dropped off more precipitously from goal for headers than for kicks. This also happened a bit more rapidly for Understat xG than for Opta xG.
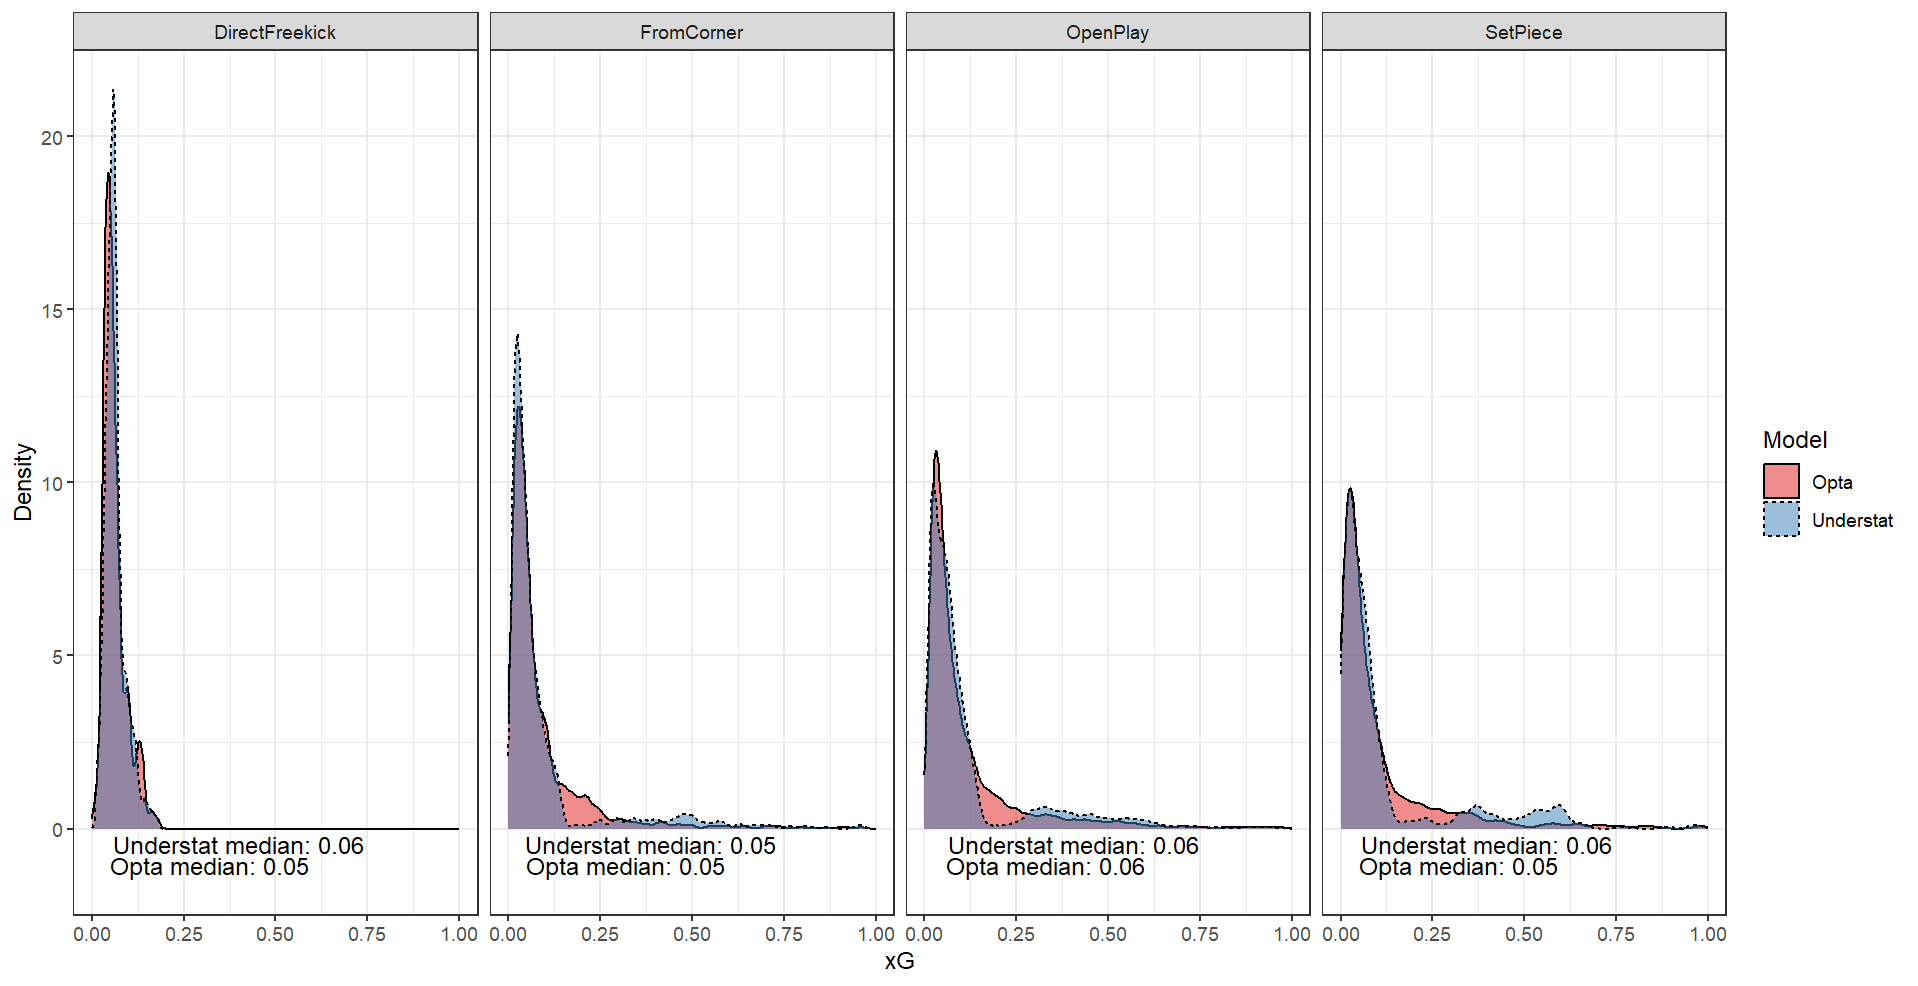
We see from the xG density plots that the fairly distinct Understat xG regions are not unique to specific play situations, though direct free kicks could not produce xG on the higher end in either model, likely due to their originating outside the penalty box by definition. The contour plot again shows the noticeable separation in the lower and higher xG predictions in the Understat model. While it appears there might be a shot distance threshold present, the data does have a few high Understat xG shots with distances greater than the 18 where such a threshold seems to exist.
Having not yet explained the stepped predictions in the Understat model, I narrowed focus to the shots between 0.19 and 0.23 xG for the corresponding Opta model. For a select number of these shots, I consulted match video to evaluate characteristics I had not examined statistically. While this is less objective as other methods of investigation, it still might yield some insight or hypotheses.
Upon video review, many of the large discrepancies where Opta xG exceeded Understat xG appear to related to the inclusion of goalie position in the Opta model. Most of these discrepancies were shots where there was no goalie (or defender, in many case) between the shooter and the goal. One of the most extreme cases had Opta assigning 0.73 xG to a shot, while Understat put it at 0.07 xG.
Looking on the opposite end of the spectrum, given the sampling of shots I watched, I would hypothesize that most of these shots where Understat xG vastly exceeds Opta xG are taken from point blank range. This may be an indication of a deeper reliance on shot location (or relatedly, shot distance or available shot angle) by Understat as more of a cornerstone of its estimate, while opposition pressure on the shooter and one or some of Opta’s other parameters also contribute substantively to its predictions.
With regards to the stratification in the Understat xG estimates, one possible hypothesis for that separation is defender presence in the direct shooting path, defined simply as the triangle between the shot location and each goal post. Almost all of the Understat shots higher than 0.24 that were viewed almost invariably do not have a defender in that area, while shots below that threshold often do. While I don’t have any written indication that Understat has defender data, the consistency in the few visuals I’ve seen make this a distinct possibility.
Closing Remarks
When examining xGs for the 2023 Premier League season, both machine learning models yield fairly similar figures on some typical performance metrics. However, they may exhibit differing degrees of bias, with the Understat model exhibiting a slightly greater tendency to overpredict goal probability in this dataset. Also, with the visualizations we now have a conception of how xG relates to shot location, situation, and other circumstances for each model. And lastly we now have more information on how knowledge of defensive position might inform each model, and how the informational imbalance might impact the resulting predictions.
There are a few considerations to remember. I leaned on data provided by Understat, which could disadvantage the Opta model a bit since there would be some measurement misclassification with respect to data used in its model, such as for shot location. Accuracy with respect to the true shot events might also be an influence, but I am unable to determine which data source has better information.
Also, as stated before, there may be some limitations to generalizability to other leagues. Additionally, the two models could certainly perform better if those leagues generated a lot of data used for their training. Performance differences could also vary for other reasons, such as diminished performance if poorer goalkeeping reduces the predictive importance of other factors that Opta has but Understat does not.
The videos I viewed were skewed towards actual goals scored, since those were always present in extended highlights. Footage of misses, however, were less available. Fuller access to video and more time spent on the visual analysis should yield more accurate assessments.
But as it stands, I think we at least have a surface-level picture of some relationships driving these two goal prediction models. Of course, these relationships don’t exist independently, and the manner in which these factors conspire and relate with other unmeasured ones to truly impact shot probability is much more complicated. It will be interesting to see how these models further evolve as more information is made available to them, and more computing power is applied to train them.