This project originates from a Kaggle challenge issued by Nick Wan, sports analytics professional (and generous coding knowledge sharer via Twitch stream) to predict F1 lap times given a smallish set of about 30000 data points from 1996-2023 and a couple hours to accomplish it. I had been itching to take a new R installation of CatBoost, the machine learning algorithm, out for a spin, so I signed up. I ultimately had some issues troubleshooting some incompatibility between CatBoost and the parallel package, and never submitted. But I still thought it was a fun problem, and worth revisiting at a later date, such as now.
To start, I know next to nothing about F1 and open-wheel racing outside having watched a couple Indy 500s as a child and whatever might be gleaned from Sacha Baron Cohen’s character in Ricky Bobby. But I imagined that the different track sizes and shapes drove most of the differences in lap time, with race-day differences coming down to differences in driver skill, how well the car was running (which some constructors may be consistently better at), and perhaps external track conditions like weather. The dataset certainly had a few variables, so those would certainly be a good place to start.
However, a quick plot of the race data showed that a large issue needing to be conquered was going to be outliers. While most lap times typically fell into a neat range, there were generally a cluster that exceeded those values by 10-fold. I first assumed pit stops were responsible, and the available pit stop times would easily extinguish the problem, but that was not the case. The competition test dataset also had included a number of driver-laps where these outliers occur, so ignoring them was probably going to yield a poor competition score. Given the magnitude of these values, failure to find a way to predict these could dominate the errors when predicting dataset values.
My first instinct was, of course, “I can fix this!” It probably would just require a little extra research. The clustering of these values for multiple racers at similar, if not the same laps, pointed to race-wide issues. I did know that caution flags existed, so I looked to outside data to be able to explain these values better. Kaggle proved to be a valuable resource. A little research revealed the fact that there could be reduced speed laps led by a safety car if hazard (e.g. debris) needed to be cleared, as well as red flag race stoppages when conditions proved too dangerous to continue. A cursory comparison of these laps to the competition dataset outliers lined up fairly well, so the outlier issue certainly seemed fixable.
Of course, my research there are other complications that would likely merit adjustment. The first lap should be slower because cars have to get up to speed from a standstill, as would similar race restarts after red flags. There are also rolling starts where the field is running at a lower speed until the safety car leaves the track that should impact lap times as well.
The evolution of rules within F1 promised to be influential over different iterations of the races as well, whether it be the elimination of fuel stops causing changes in the amount of fuel the cars were carrying throughout the race, or how red flags procedures changed throughout the years encompassed by the dataset period.
Given the multifactorial nature of these races, I was curious to see if a large number of categorical and indicator variables could essentially hand-hold the machine learning models and yield improved predictive models, or if overparameterization would do more harm than good.
Predictors
Driver-Lap Level
Lap Number (both sets) - Cars are less weighed down by fuel as the race proceeds and should go faster
Lap Position (both) - Faster cars are probably ahead in the race
Lap Position Change (both) - Passing or being passed may be an indicator of relative speed, while a large drop in position could be an indicator of mechanical difficulties
Pit stop (limited only) -Pit stops involve a different part of the track, slowing to a stop, and speeding up to get back to race flow
Pit Time (both) - Time spent in a pit stop adds to the time of a lap
Race leader (expanded set only)- Indicates what is likely a fast car that does not have to deal with traffic in front of them and should thus be running at its maximum speed
Lap Level
Last lap (limited set only) or last lap finished/last lap DNF (expanded set only) - May help indicate a problem if the last lap is not a complete race, or drivers may drive faster or slower given the specific stakes at the time
Red flag lap (both) - Indicates the occurrence of a serious hazard that requires stopping the race and moving the competitors back to the pits until the hazard is resolved
Lap after red flag (both) - Indicates a lap run at a managed speed to get up the cars warmed up
Lap 2 after red flag (both) - Indicates a lap run from a stopped starting position to restart the race
Initial safety car lap/Subsequent safety car lap (both) - indicates a lap run at managed speed while personnel manage a hazard, with initial laps theoretically having front runners having run more of the course at full speed before hazard declared
Restart from safety (expanded set only) - Indicates a likely slower lap due to the need to accelerate from a managed speed to resume unhindered racing
Race Level
Date (expanded set only)/Year (expanded set only)/Race-date (limited set only)- Indicator for a specific race
No fuel years (expanded set only) - Indicator for races run after refueling was eliminated from races
Circuit (expanded set only) - Indicator for the track run, which can change for some races
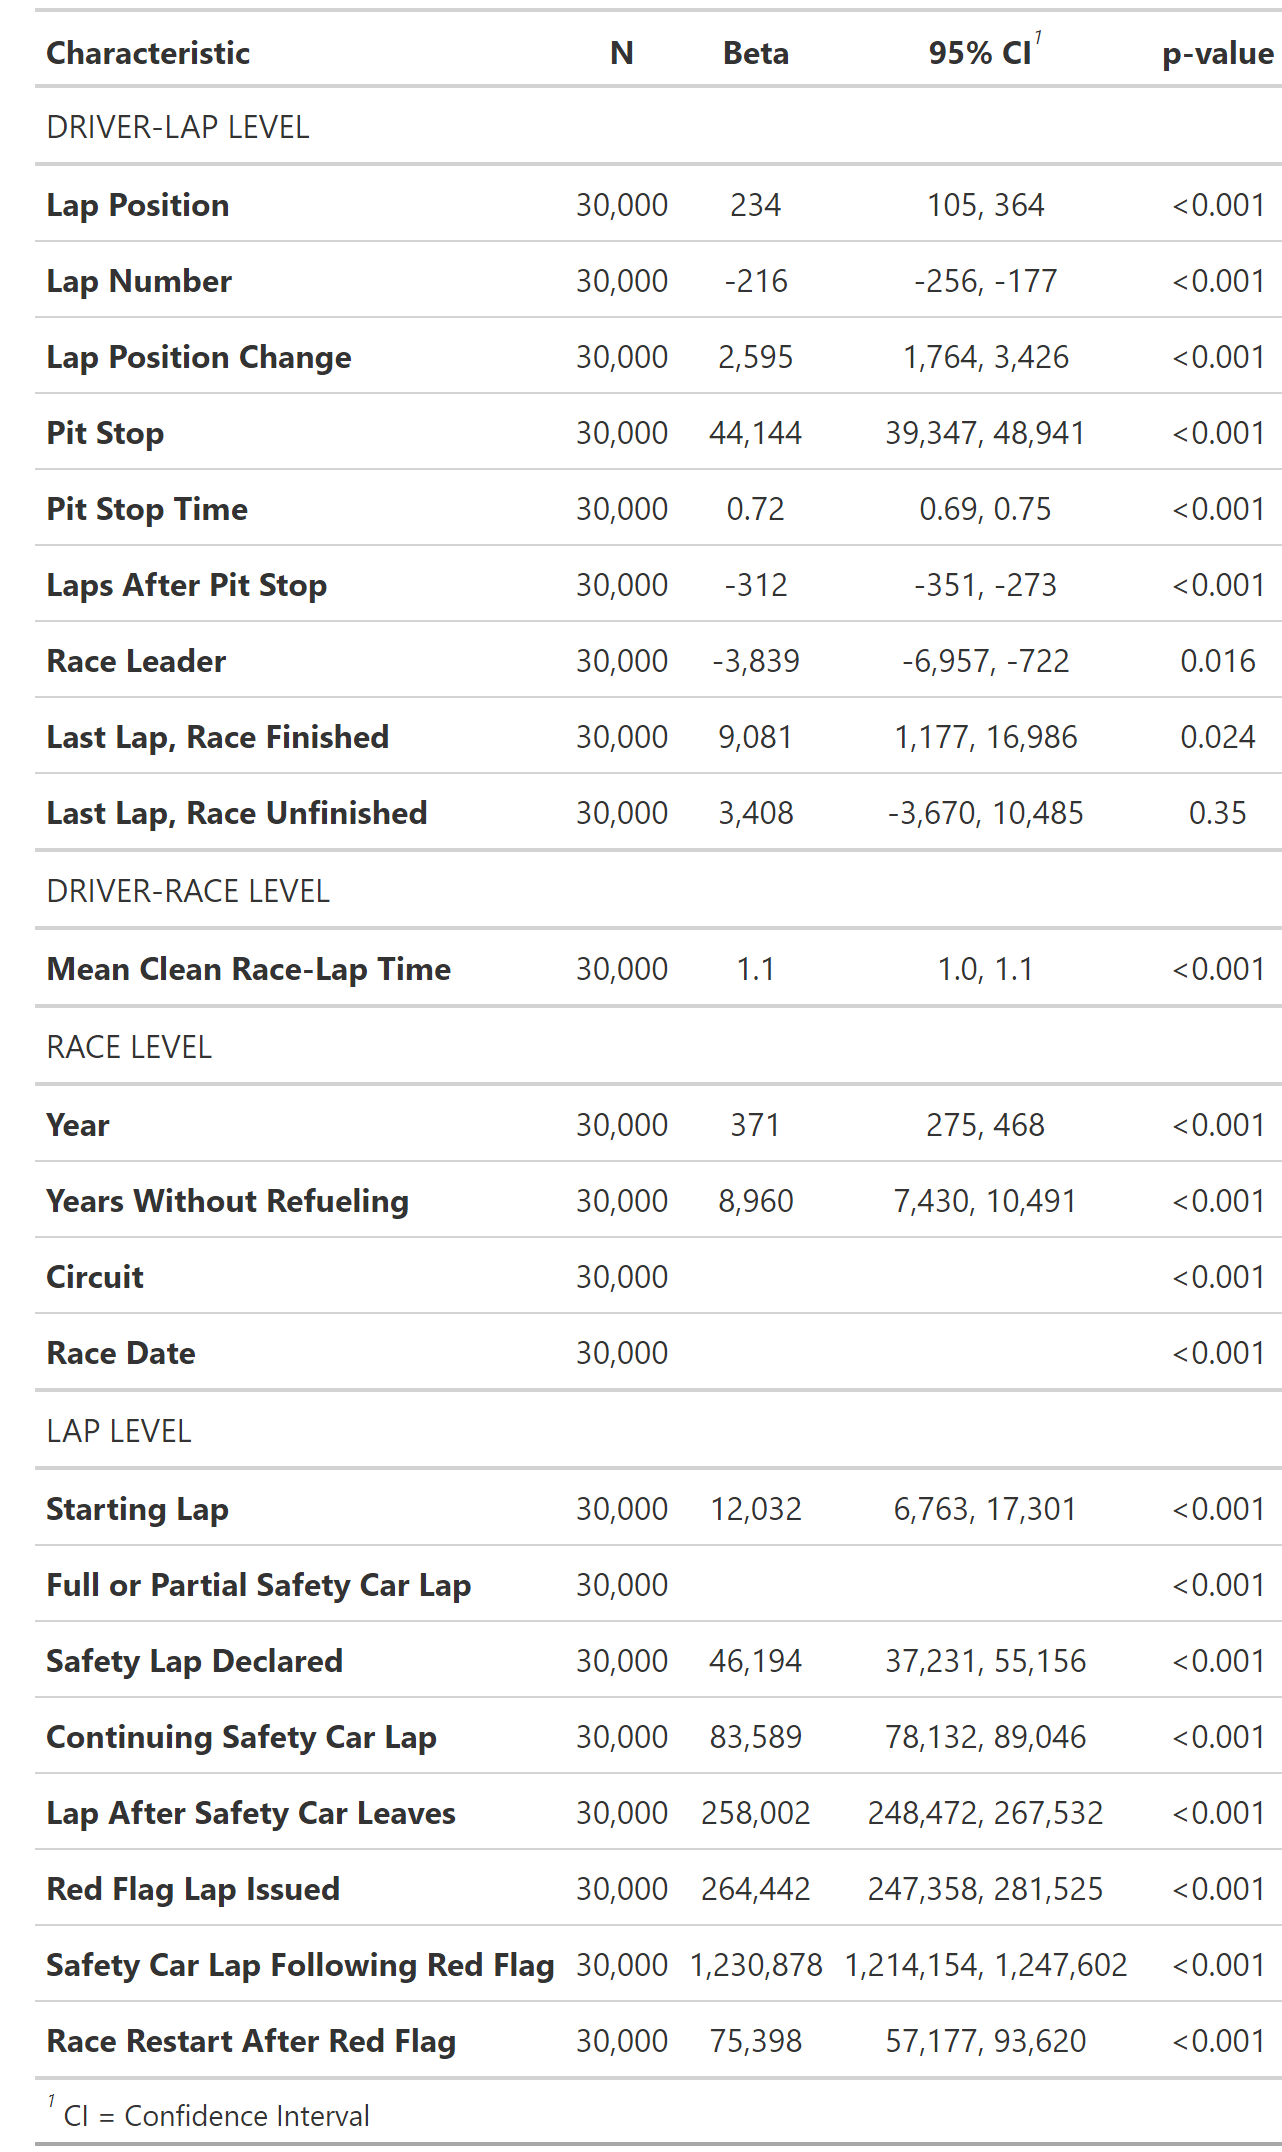
Modeling
I first opted to train the dataset with a random 80% of values, reserving the other 20% for testing. I also wanted to employ cross-validation to minimize overfitting, so the training dataset was split into 5.
My original purpose was to apply CatBoost as the algorithm given the need to projected need to lean on categorical variables for driver and track. XGBoost does have a lot of tunable parameters, so I employed the Bayesian optimization implementation in Tidymodels to tune select tree_depth, min_n, loss_reduction, sample_size, learn_rate, and mtry (parameter name translations) using the tune_bayes. For CatBoost fitting, parameter tuning was limited to learn_rate, min_n, and tree_depth.
Model
When comparing XGBoost models, additional categorical variables have remarkably little impact on the ultimate fit I see with the final model. This is despite the fact that such variables have strong associations with the lap time.
| Smaller vs. Larger Predictor Set, Train and Test Sets |
| Training Set |
Test Set |
| XGBoost |
| Limited Predictors |
4186 |
11824 |
| Expanded Predictors |
61 |
20899 |
| CatBoost |
| Limited Predictors |
9567 |
11712 |
| Expanded Predictors |
14560 |
17395 |
Table 2. Model Fit Statistics.
At least for this case, CatBoost did ultimately perform a bit better than XGBoost modeling at predicting the test set lap times. Some of that could have been an overfitting issue, as XGBoost did produce models with lower RMSE in the training dataset.
Despite the strong univariate correlations between lap times and many of the predictors added to the expanded predictor set, the limited predictor set produced better model fits in most cases. This could have been a case of overparameterization.
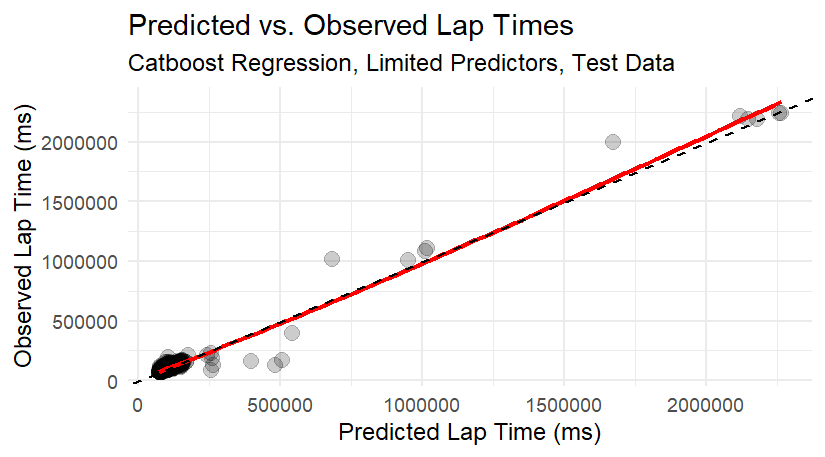
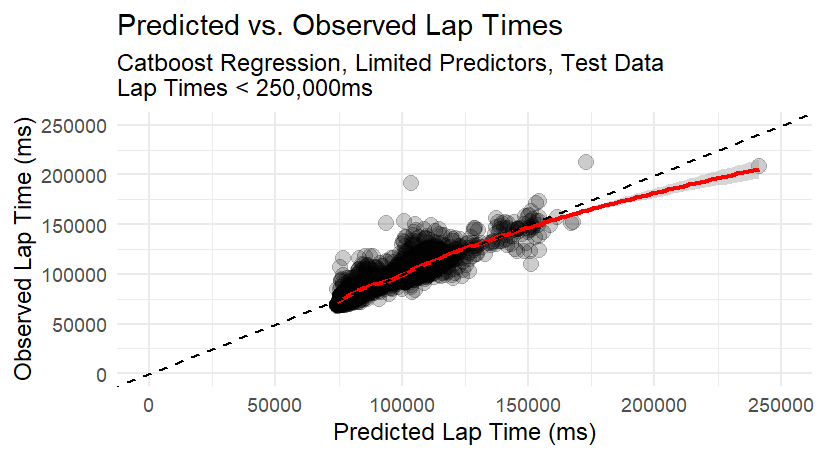
Closing Remarks Looking over the resulting predictions, there are still some issues that I haven’t yet feature-engineered out. One contributor is that, while we have flag status for those on the lead lap, we do not know which cars might be straggling behind the lead lap, and thus offset from the safety and red flag lap indicators. I also saw some entries where the pit stop times exceed the lap times, which I’m unable to logically resolve despite my exploration of F1 rules. As a result, the final model still produces 4.7% of the absolute error from a 0.2% subset of laps in the test dataset with exceptionally long lap times. It’s not as bad as I anticipated from the figures, but still show that these influential points are likely skewing the model.
Given that in most instances, it’s more important to predict the more typical situations, it’s best to give up training specifically for the competition score. Instead, given the fact that many of the troublesome outliers are coming from two specific races, I’ll drop those and retry the modeling.