
I personally found it startling and dismaying to find out that the World Cup, the internationally sought-after symbol of footballing triumph, isn’t a cup at all. It’s just a sculpture of two humans holding the planet. But as someone who has no chance of actually playing in the tournament, the World Cup is just as much the giant avalanche of data as it is a trophy or sports event. So, just as a fun post, here’s a compilation of some data visualizations I generated from World Cup data to help me understand and enjoy the experience.
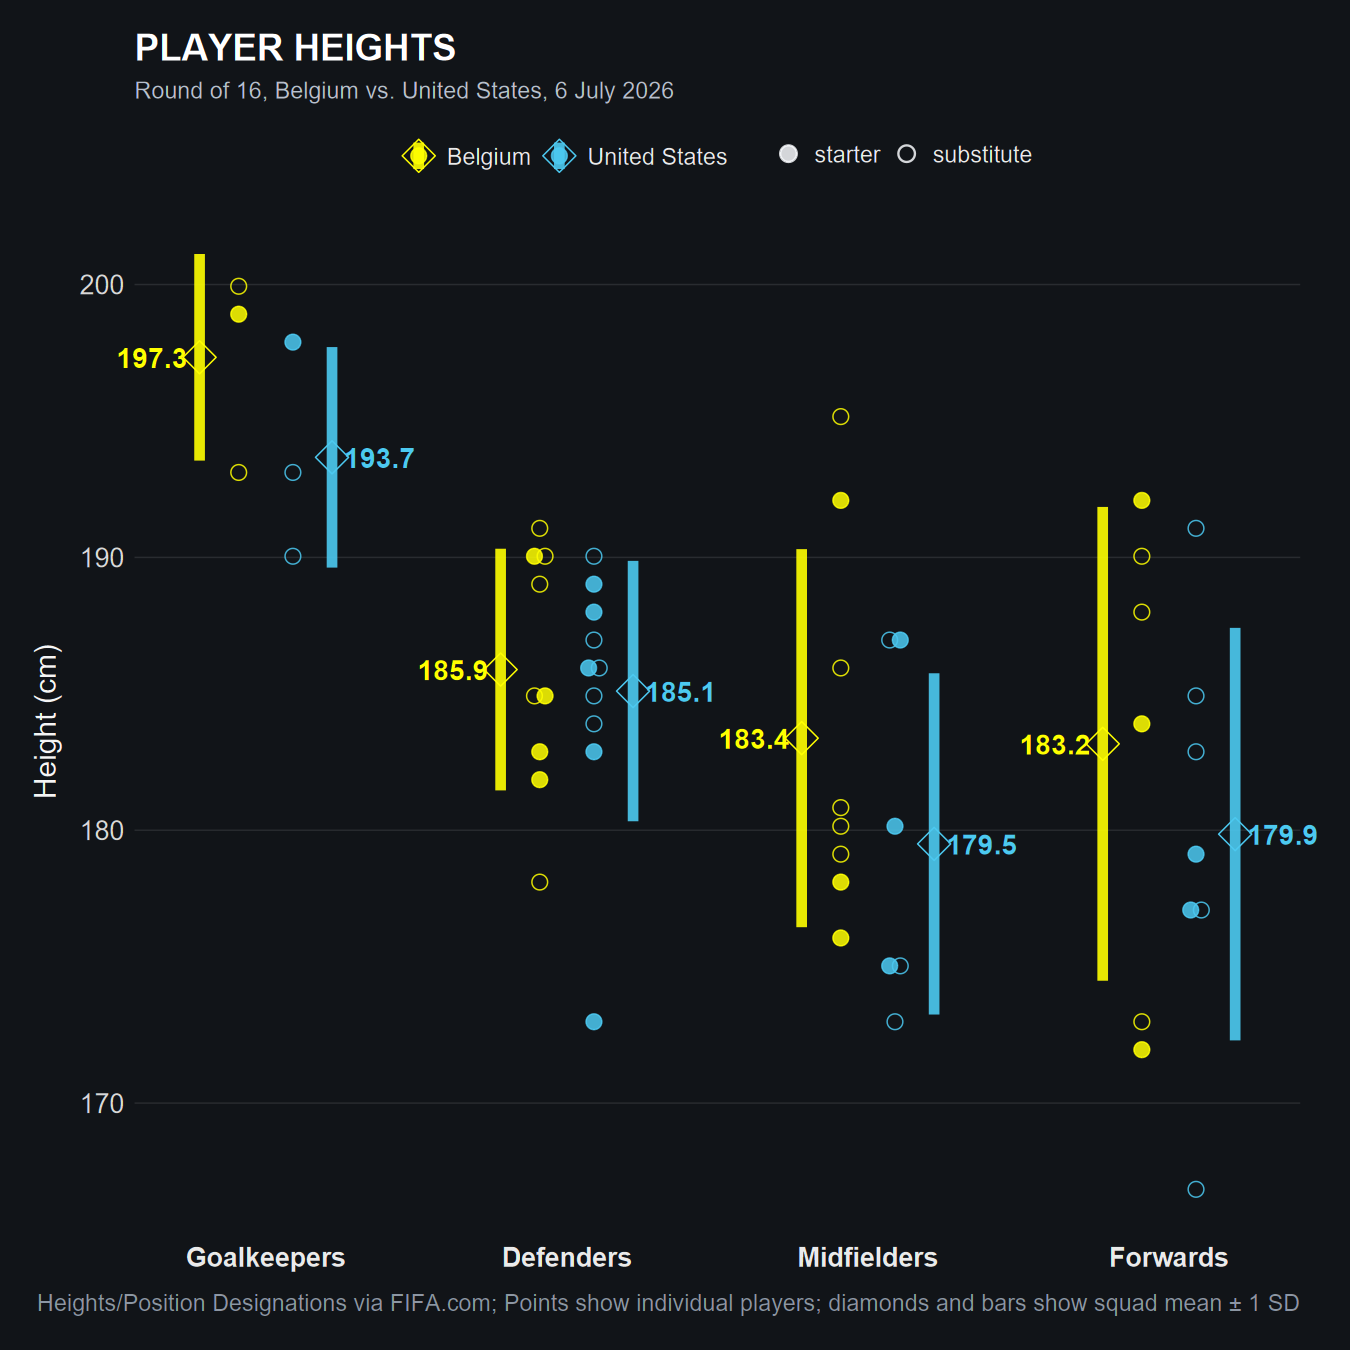
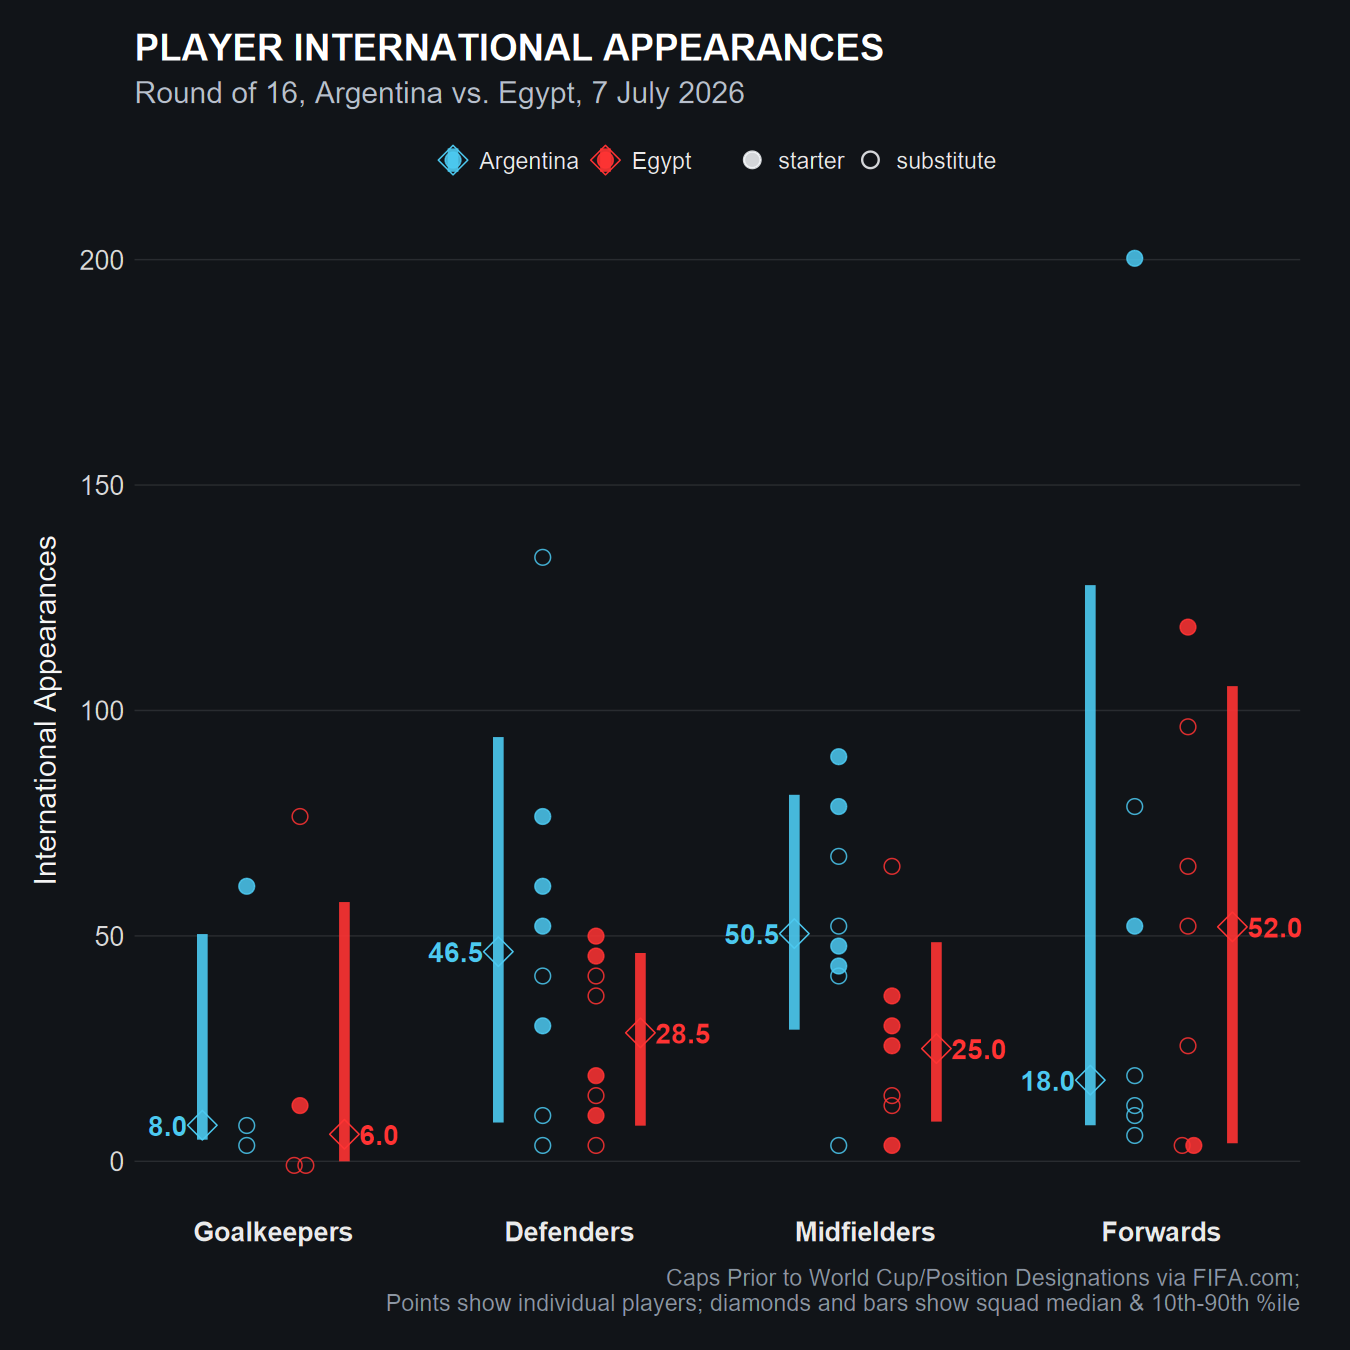
To no surprise, using data to try to characterize upcoming sports match-ups is a handy way to inform one’s viewing. For example, I used data provided by FIFA on the teams to visualize how Belgium fielded some fairly tall players who might cause the US some issues (Figure 1). Ultimately, Belgium’s second goal to retake the lead would come from a towering header from De Ketelaere, who rose above U.S. captain Tim Ream to score it. I also plotted the wide gulf in international experience between an upstart Egyptian squad and defending champions Argentina in their knockout matchup (Figure 2). Argentina’s experience would serve them well, as they remained calm despite an early deficit, and found the win via two late match goals.
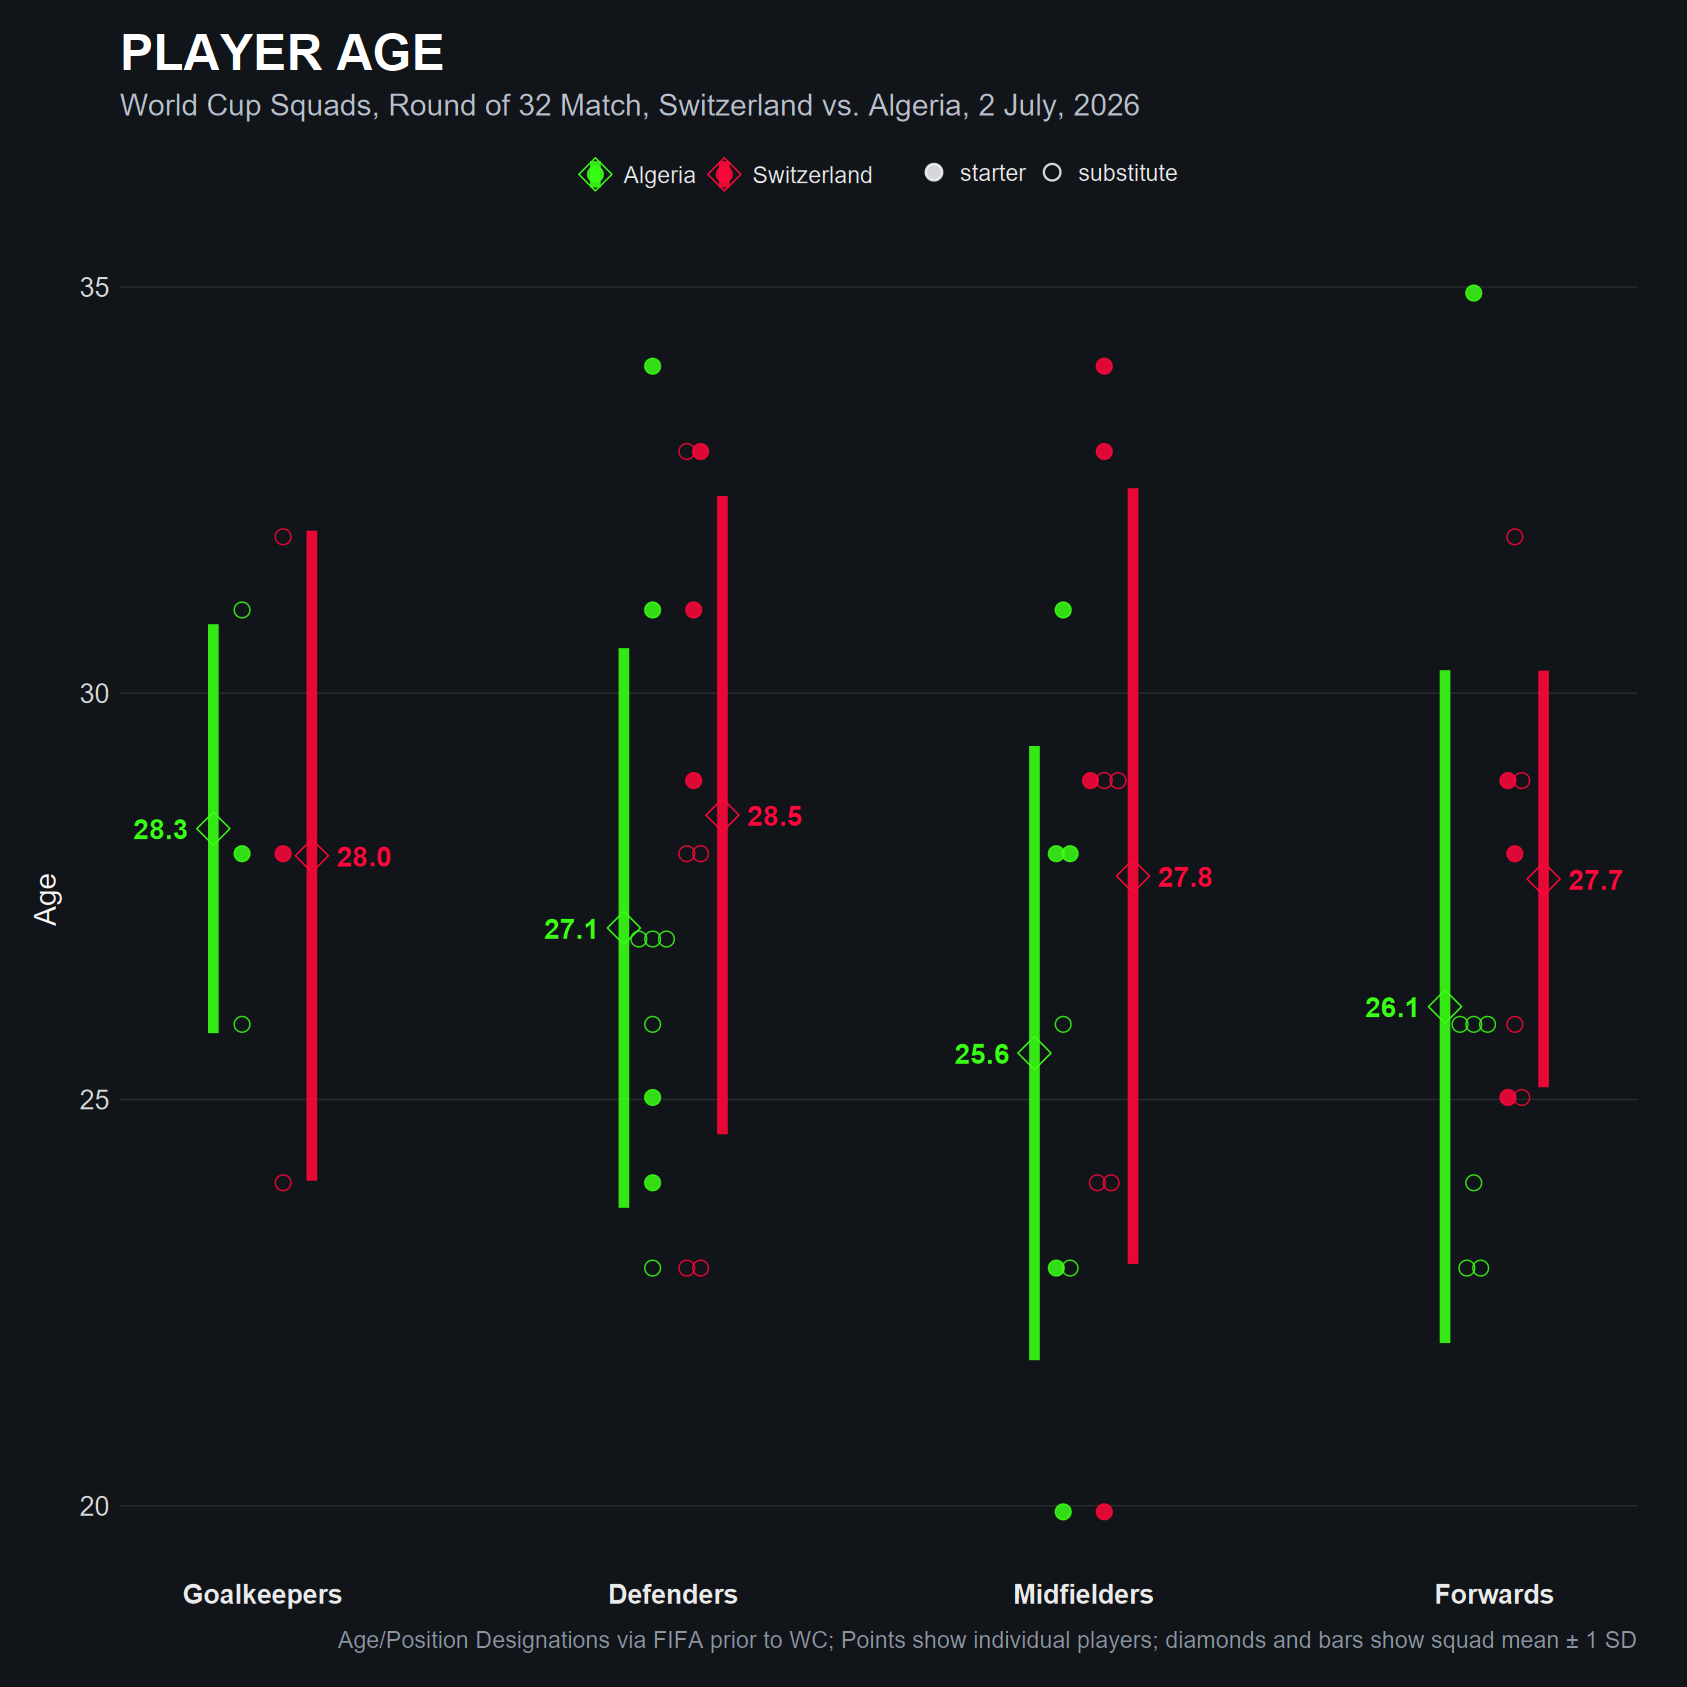
Below, another viz served to illustrate the fact that Algeria and Switzerland were fielding their oldest and youngest players in a knockout match, to ostensibly combine youthful energy, audacity, and athleticism with the wisdom, guile, and emotional steadiness of experience to net the best performance out of their lineups.
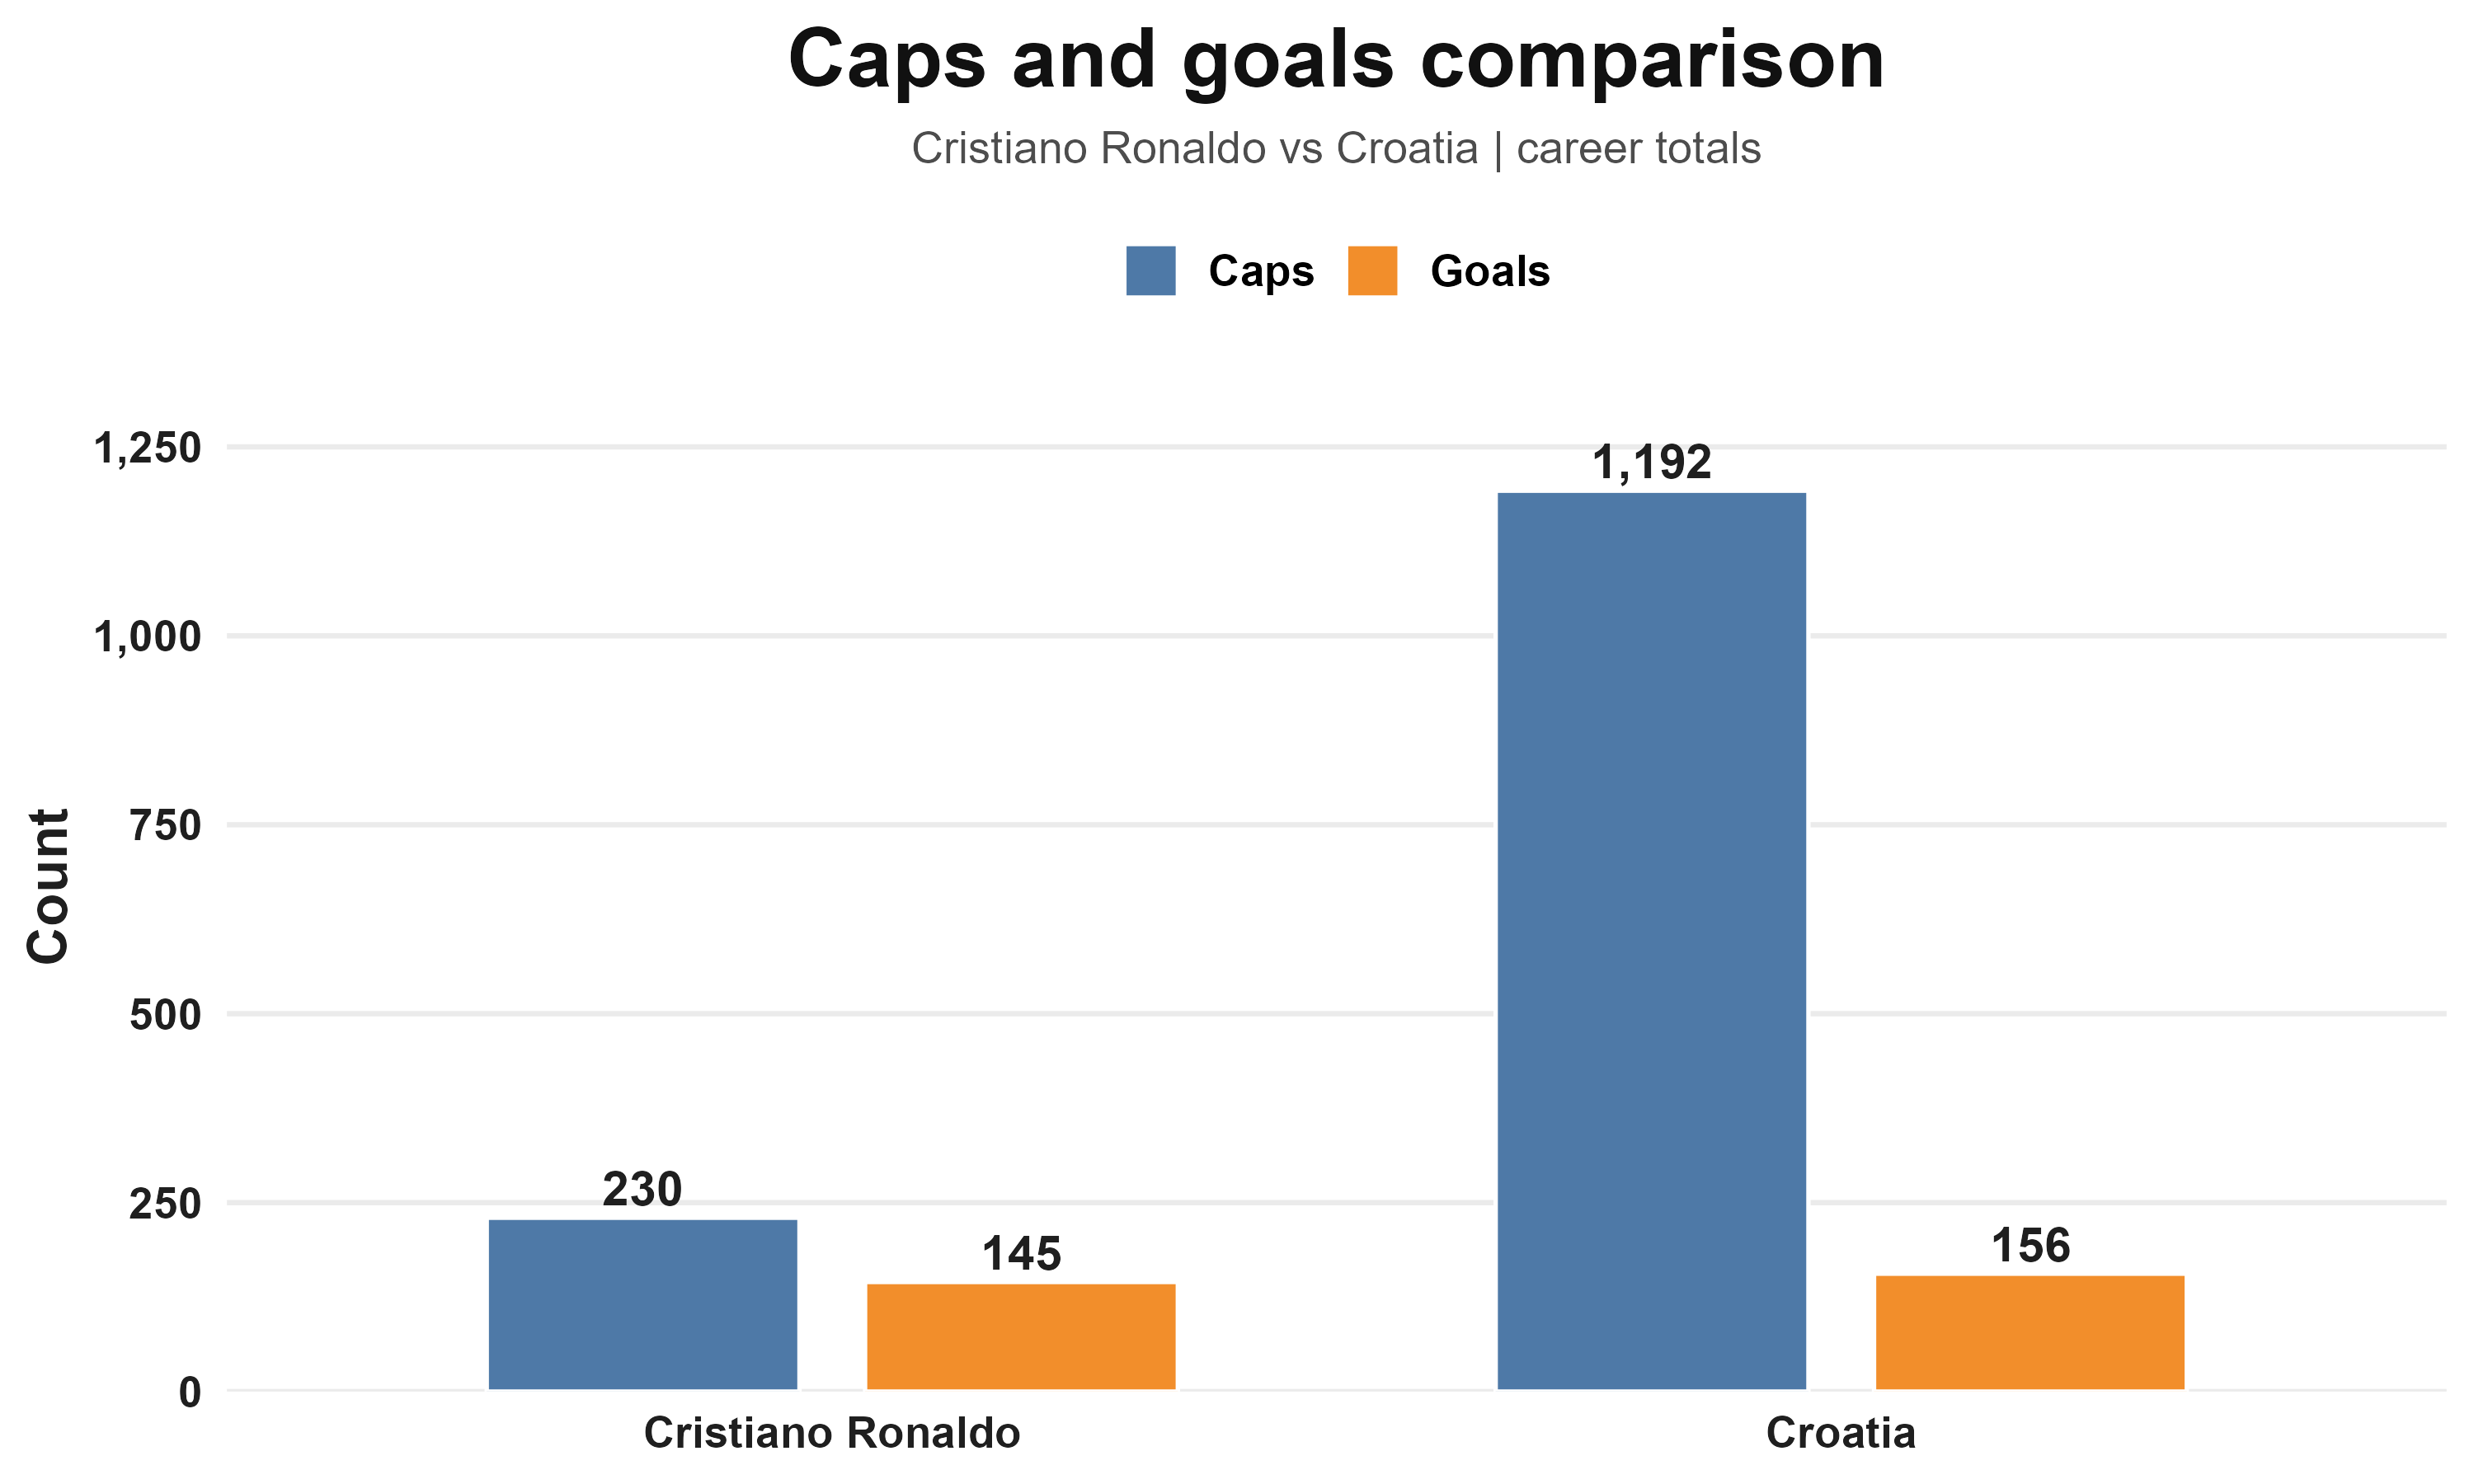
Sometimes, a quick data viz is just a fun way to bring a fact to life, like how going into the Portugal-Croatia matchup, Cristiano Ronaldo has almost as many goals in international play as the entire Croatia squad. Mind you, that Croatia team includes a number of heralded offensive veterans, and their team has found a great deal of success throughout its existence. Ultimately, it serves as a reminder that CR7 has been very good for a very long time.
Once a match has come and gone, some aren’t satisfied with a mere final score. They want a more in depth feel for how the match truly went, some summary of the ebb and flow (or lack thereof). For match progression, the current meta is to map out each team’s xG accumulation in a step chart, but I’ve always found those to not be particularly engaging. So I tried a different route to display shot frequency and related xG, shown below. I think this format does bring the number of shots more to the foreground, albeit by making the already tough task of seeing the xG for each shot even tougher. But I would argue that the number of shots itself is an indicator of offensive pressure being applied, since they must take place from threatening positions.
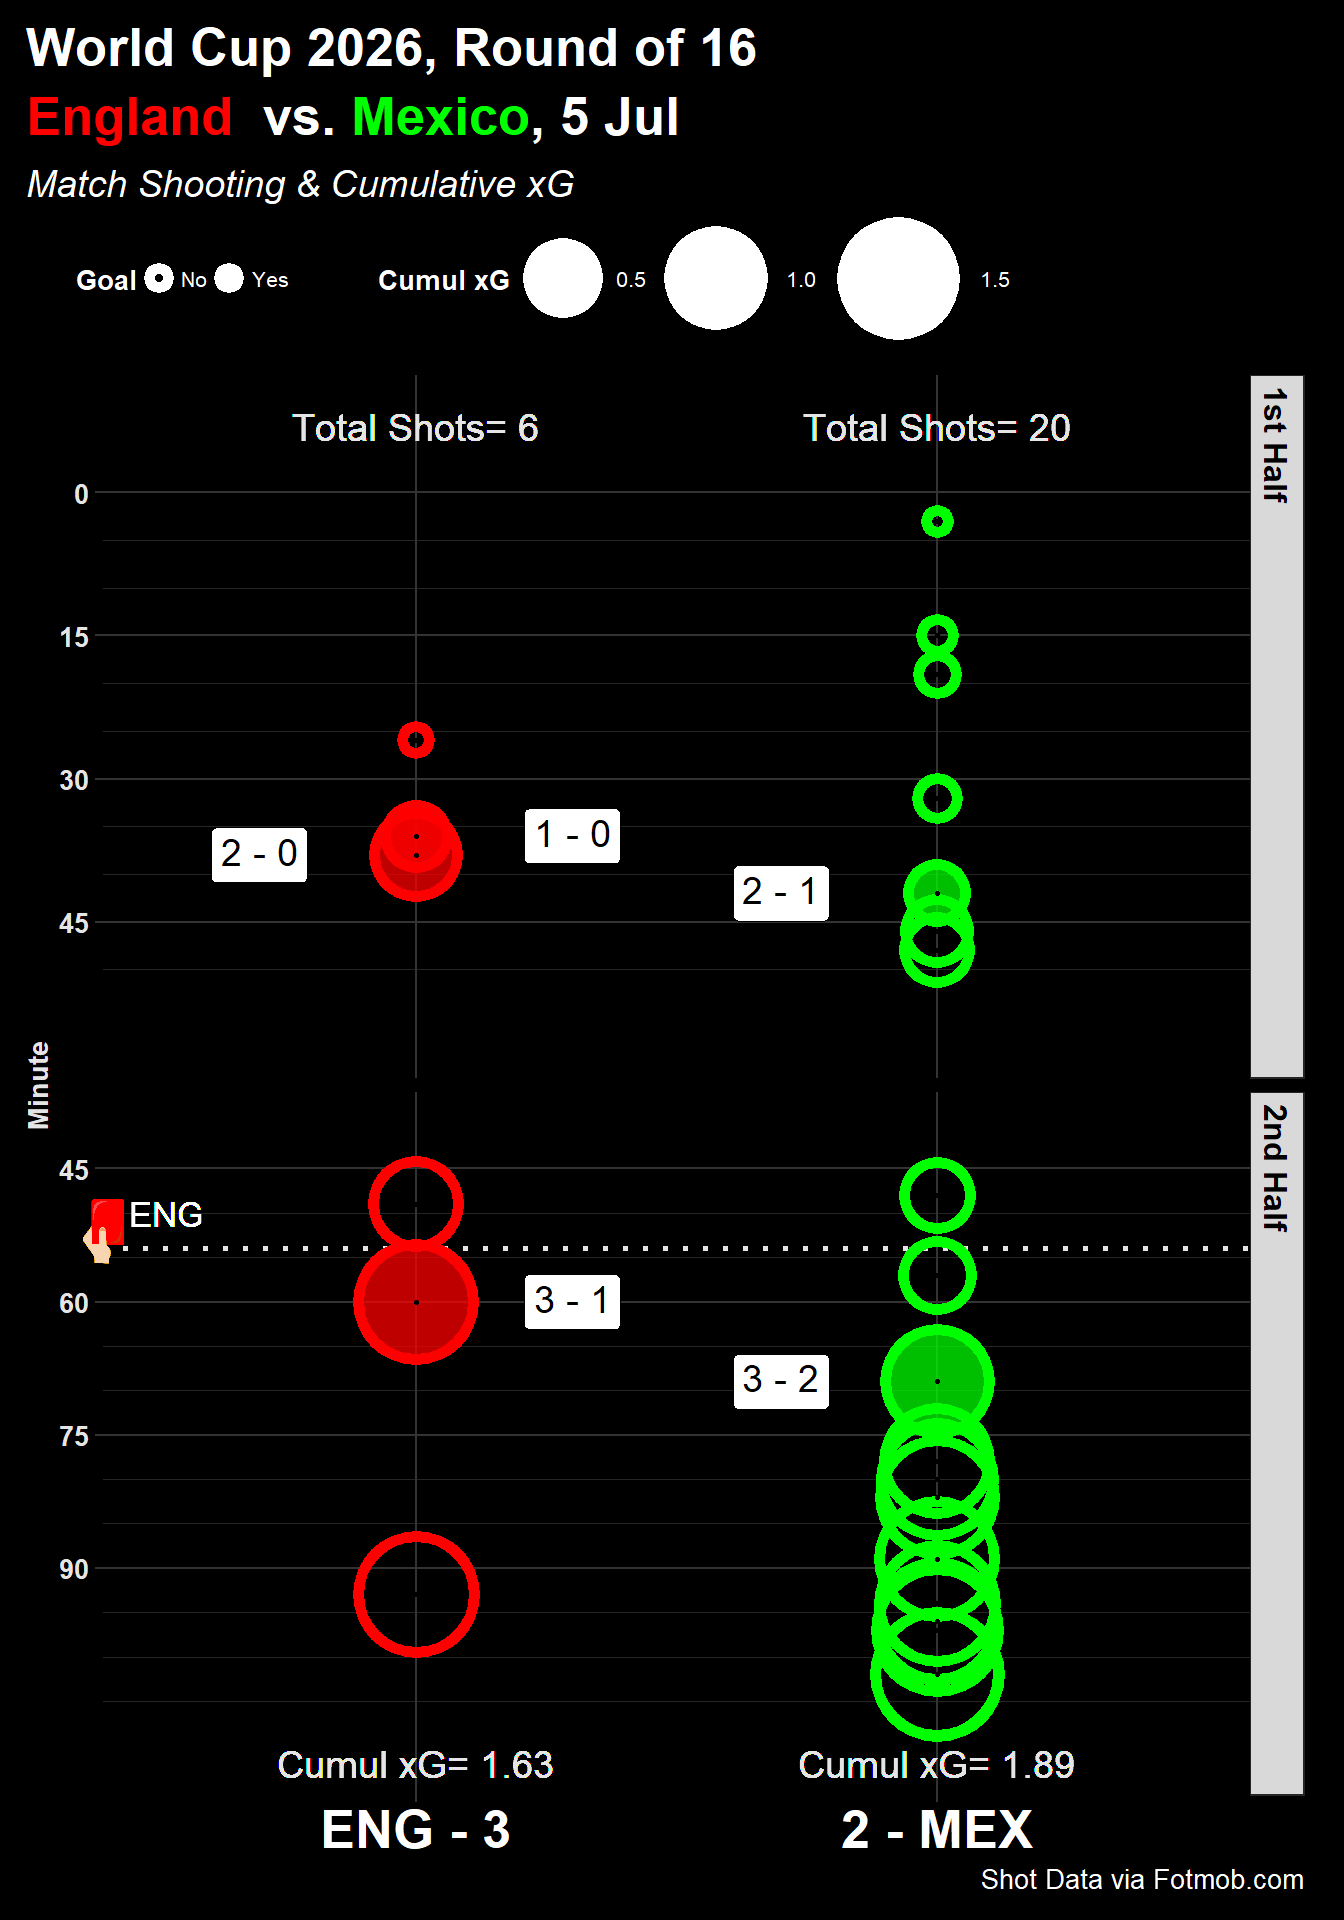
Figure 5.
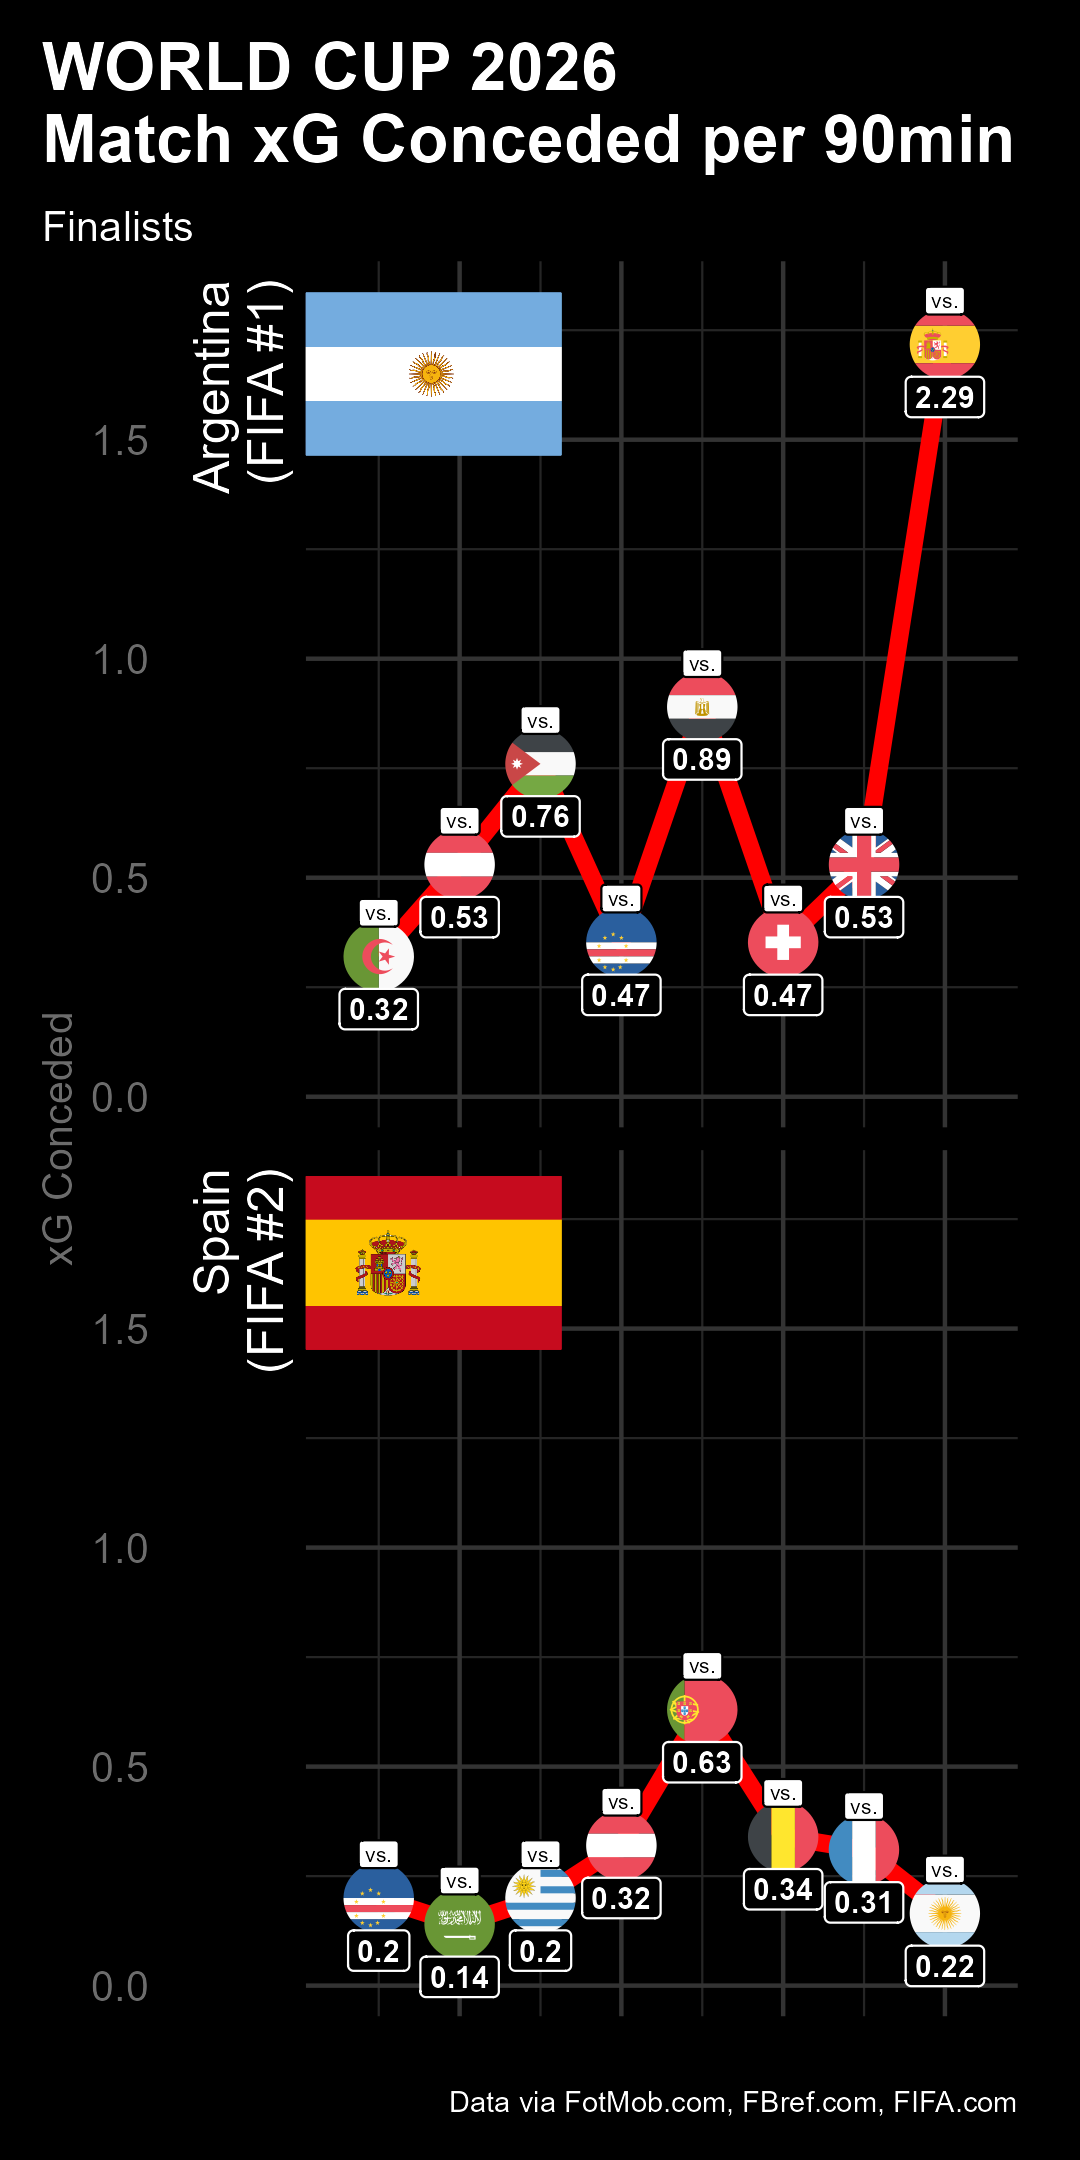
Of course, visualizations can also succinctly characterize a dominant multi-game tournament run. Spain proved quite adept at not only keeping their opponents out of goal, but also from posing any credible threat when Spain was not in possession. Even compared side-by-side with their ultimate final opponent in Argentina (who were a very respectable 5th in expected goals conceded), their defensive stinginess shines through. From all reports, this was a combination of a high amount of possession (1st in tourney), aggressive and effective counterpressing out of possession (2nd in forced turnovers per 90), and defensive skill (1st in opponent shots on target allowed) that allowed them to essentially suffocate their opponents and secure the championship.
And for those to whom the World Cup has bequeathed a number of parasocial “friendships” to keep up with (looking at you, social media breakout star Erling Haaland), the map below should help you identify which leagues might be best to track the professional careers of as many as possible (Figure 6). It probably isn’t much of a surprise that England hosts the most World Cup players (199) given that it is home to the biggest revenue-making league (EPL), and even its 2nd tier Championship is 7th in revenue worldwide. That money should make it a lot easier to attract many of the world’s best players. Germany, Spain, France, and Italy follow suit in terms of World Cup participants, which certainly coincides with their status alongside England, as the “Big 5” leagues. Saudi Arabia follows, though half of the World Cup footballers that play there professionally are from their own national team, the largest proportion among the top 10 nations.
Figure 6.
That wraps up what I have to share at the moment. While its intent was, by and large, to serve as my own idea repository for other projects, I hope its existence serves as a source of inspiration or illumination to those who might wander by. Best of luck on your own data journeys!