Player compensation in the NFL can be quite complicated, with one often having to navigate through a number of payment provision types (e.g. base salary, signing bonuses, injury guarantees) to even get an inkling of what might be paid out. From the player perspective, however, it’s difficult to understate the importance of guaranteed money in the structure of any contract they sign. Given the exposure to bodily violence and the physical toll that football exerts on the body, one wrong step could spell disaster. An entire remarkable career built up from childhood—and the earning potential that comes with it—can sharply deteriorate or end suddenly. With teams loathe to bear that risk in contracts with players, it generally takes the right combination of past performance, future potential, and negotiating leverage, for a player to secure meaningful guarantees.
I’m curious as to what performance indicators posted by players in the previous year might convince teams to fork over that money. Given that wide receivers have high game visibility, post a variety of statistics that can be examined, and can garner some of the largest non-QB contracts in the game, I’ll look specifically at that position group.
Data
Just a quick data introduction:
I’ll again use the play-by-play data from the nflverse package for R to compile season-level receiving statistics, this time from the 2016-2024 playing seasons. These include traditional counting statistics (e.g. games played, targets, receptions, yards, touchdowns, 1st downs), as well as efficiency statistics focusing on per target production. Some lesser known statistics include:
EPA - expected points added based on a model accounting for yards gained, field position, and other situational variables
Air yards - cumulative distance of passes thrown to the receiver
Yards After Catch - yards accumulated by the receiver after making a reception
NFLverse also provide access to a few Next Gen Stats from NFL. This is a compilation of additional metrics that utilize player tracking data measured using sensors at the stadium monitoring player movement through tags placed in their shoulder pads. Metrics made publicly available include:
Avg. Intended Air Yards - average depth of target
Avg. Yards After Completion - average yards gained after catching the ball
Avg. Expected Yards After Completion - average expected yards after the catch, modeled on openness, speed, nearest defenders, and other factors
Avg. Yards After Completion Over Expected - average difference between actual yards after completion gained and the modeled expectation for that throw
Avg. Cushion - average distance between WR and nearest defensive player at the time of the snap on plays when targeted
Avg. Separation - average distance between WR and nearest defensive player when catch/incompletion is registered
ESPN has also derived its own receiver metrics. These metrics were created to “isolate and assess individual player performance in a consistent and objective way.”
Observational Metrics
Routes Run - Records presence on the field as a pass option
Yards per Route Run - Measures production when theoretically available to be thrown to
Modeled Metrics
Open Score - Measures likelihood that, right before the release of the ball, a receiver make a catch if they were targeted; compared to average receiver given the specific route type, route depth, and time from snap to throw
Catch Score - Probability of catch given the location, direction facing, and speed all the players on the field
YAC Score - Evaluates ability to generate extra yards after the catch given tracking data at the time of completion compared to the typical receiver
Overall Score - Weighted to mirror real-world production; ~50% Open Score, 25% Catch Score, 25% YAC Score.
And, as mentioned, the nflverse package provides access to contract data, which are sourced from Over The Cap. I’ve specifically chosen the inflated_guaranteed figures to better compensate for salary cap inflation that’s occurred throughout the course of the data.
For the purposes of this exercise, I’ll look how player performance metrics in one season are related to the guaranteed money given to that player in the following offseason (or during the next playing season in a few cases). Since this is meant as an exploratory data analysis, I’ll forego any complicated models for now and simply report Kendall correlations between pairs of variables. I’ll also generate scatterplots for each pair and visualize general trends using loess smooths. Since the NFL NGS statistics are limited to regular season and to receivers with at least 45 targets, I’ll do the same with statistics from the other sources.
Findings
Out of the 314 wide receiver contracts signed between 2017-2024, 255 did net some form of guaranteed money. Cap-adjusted values for those guarantees ranged widely, from approximately 27,000 to over 120,000,000 dollars, with the median of 6,000,000 showing that most were on the lower end of the spectrum.
Counting Metrics
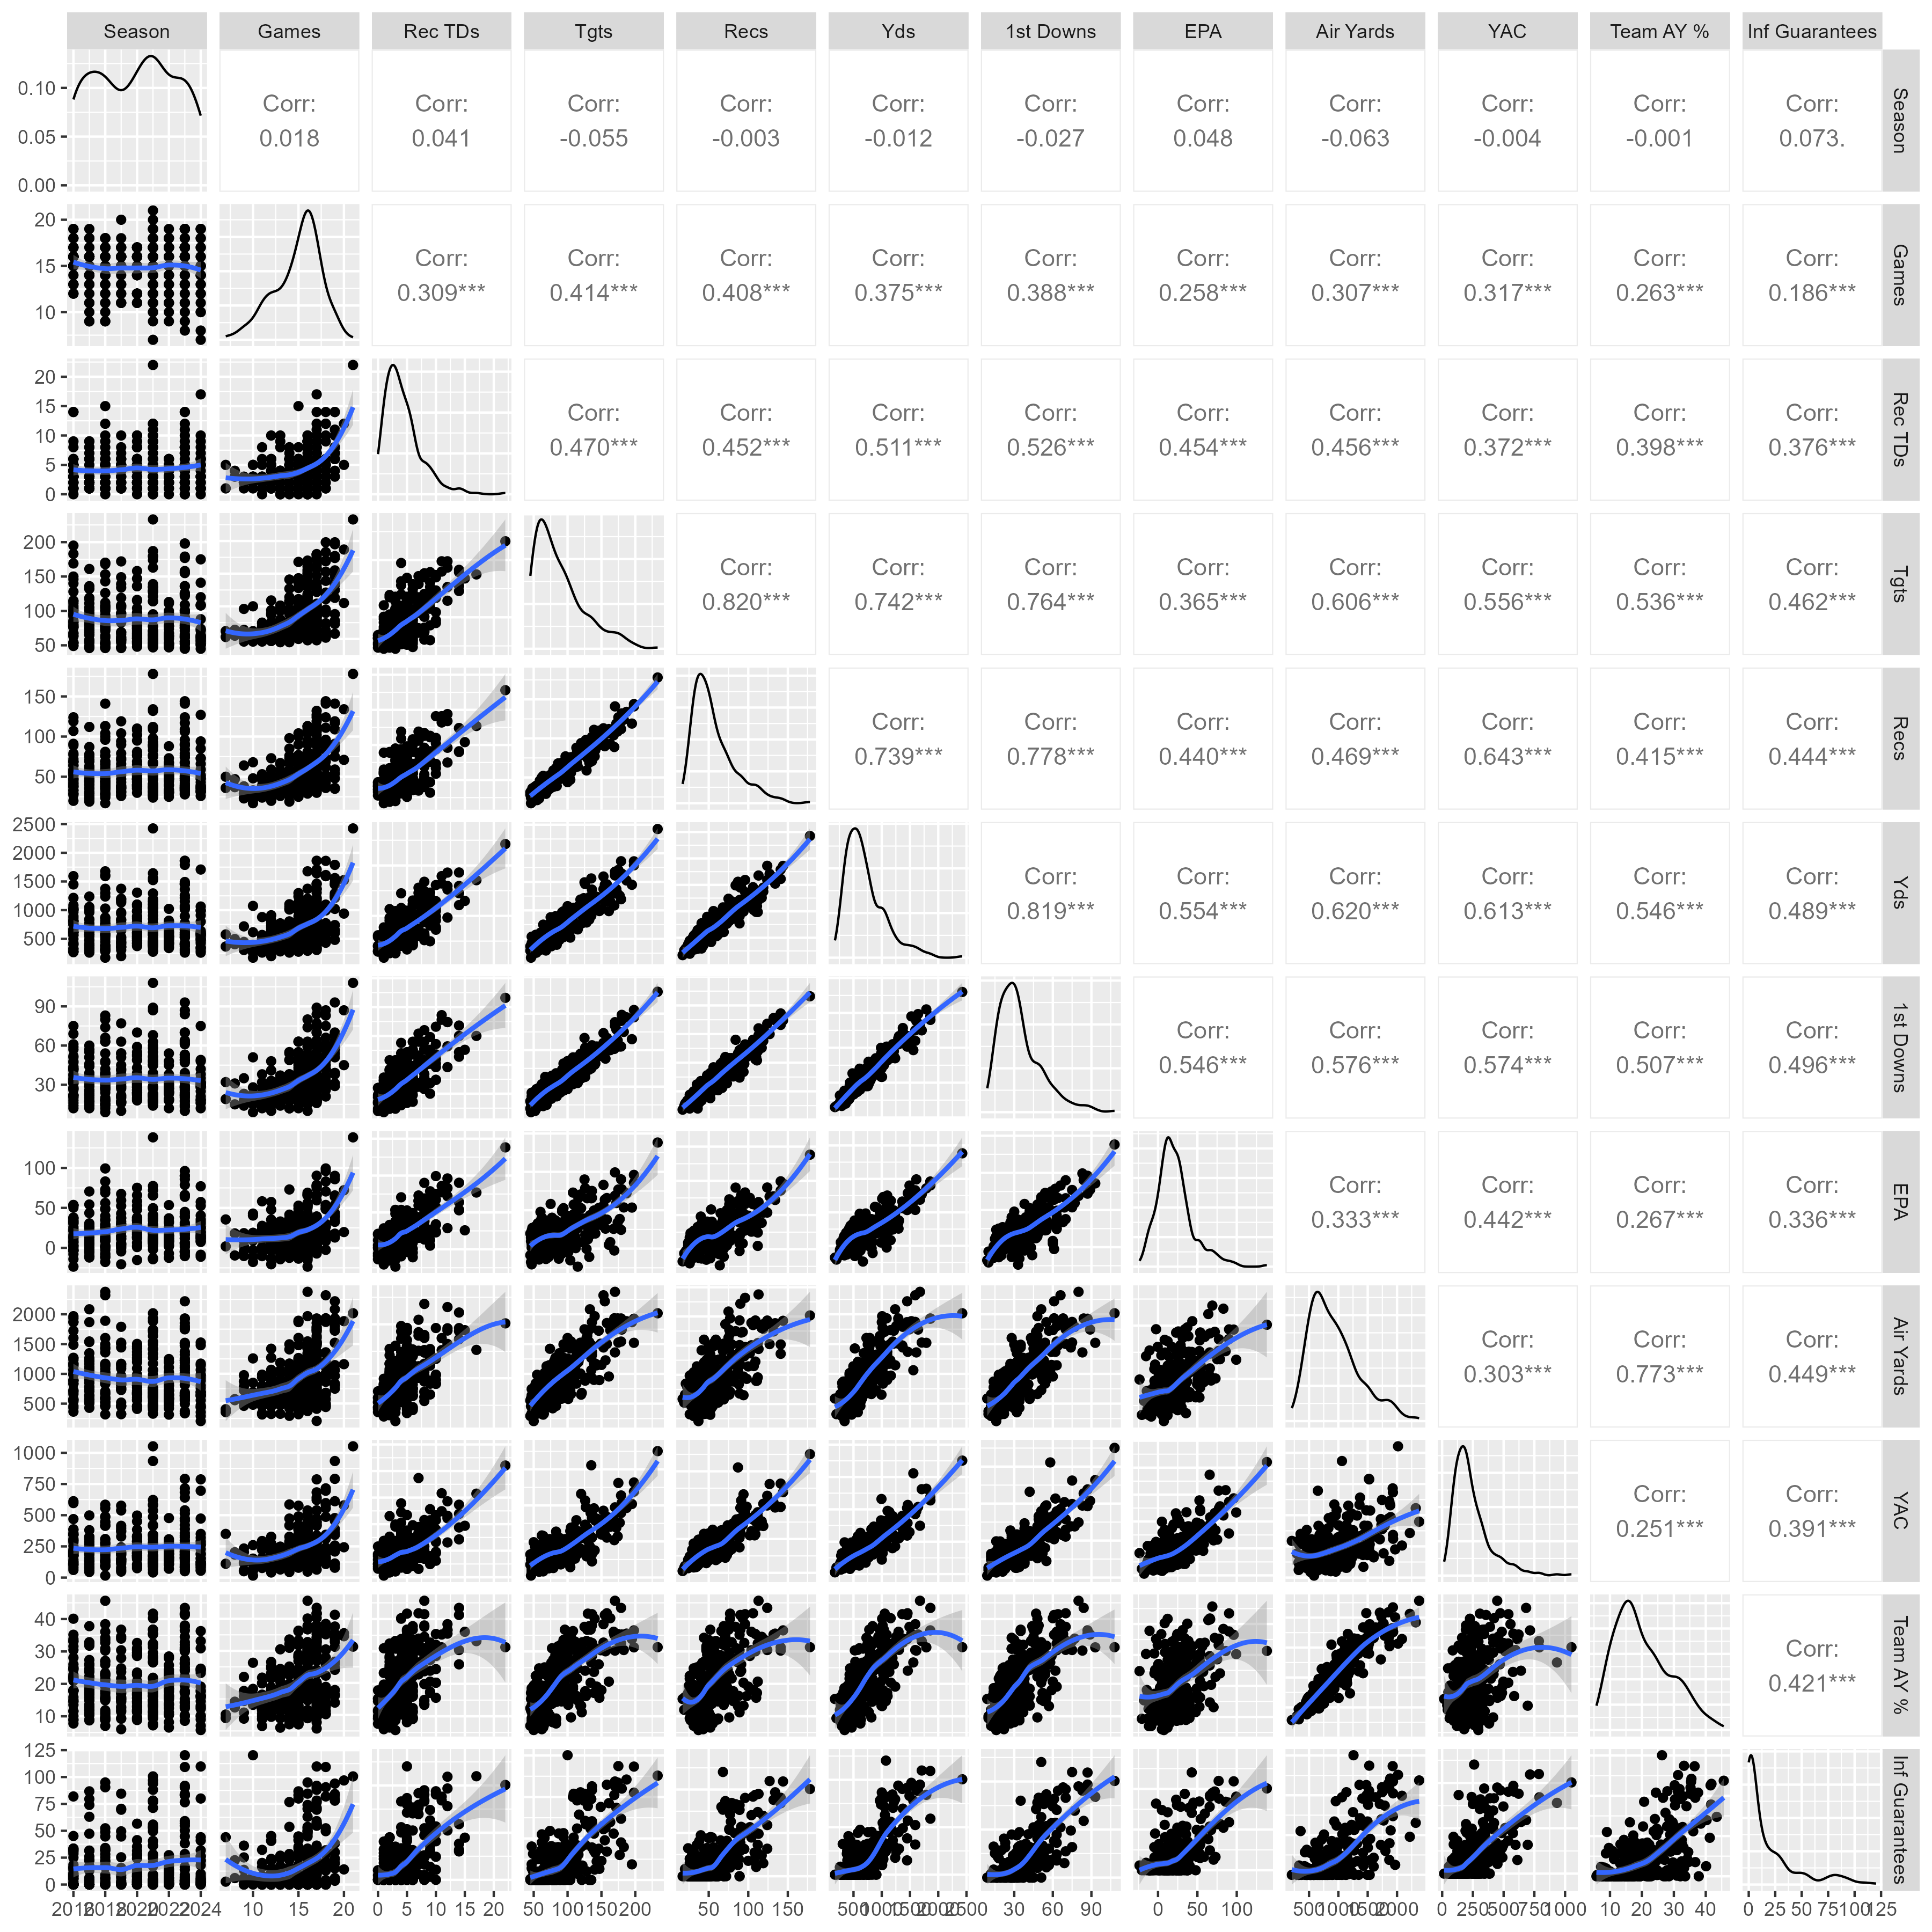
Counting statistics totaling production over the season showed the strongest correlation with guaranteed money in the next contract (right column). First downs were most highly correlated, but yards and targets weren’t far behind. Most metrics had correlations above 0.40, with weaker correlations for total EPA, yards after catch, and touchdowns.
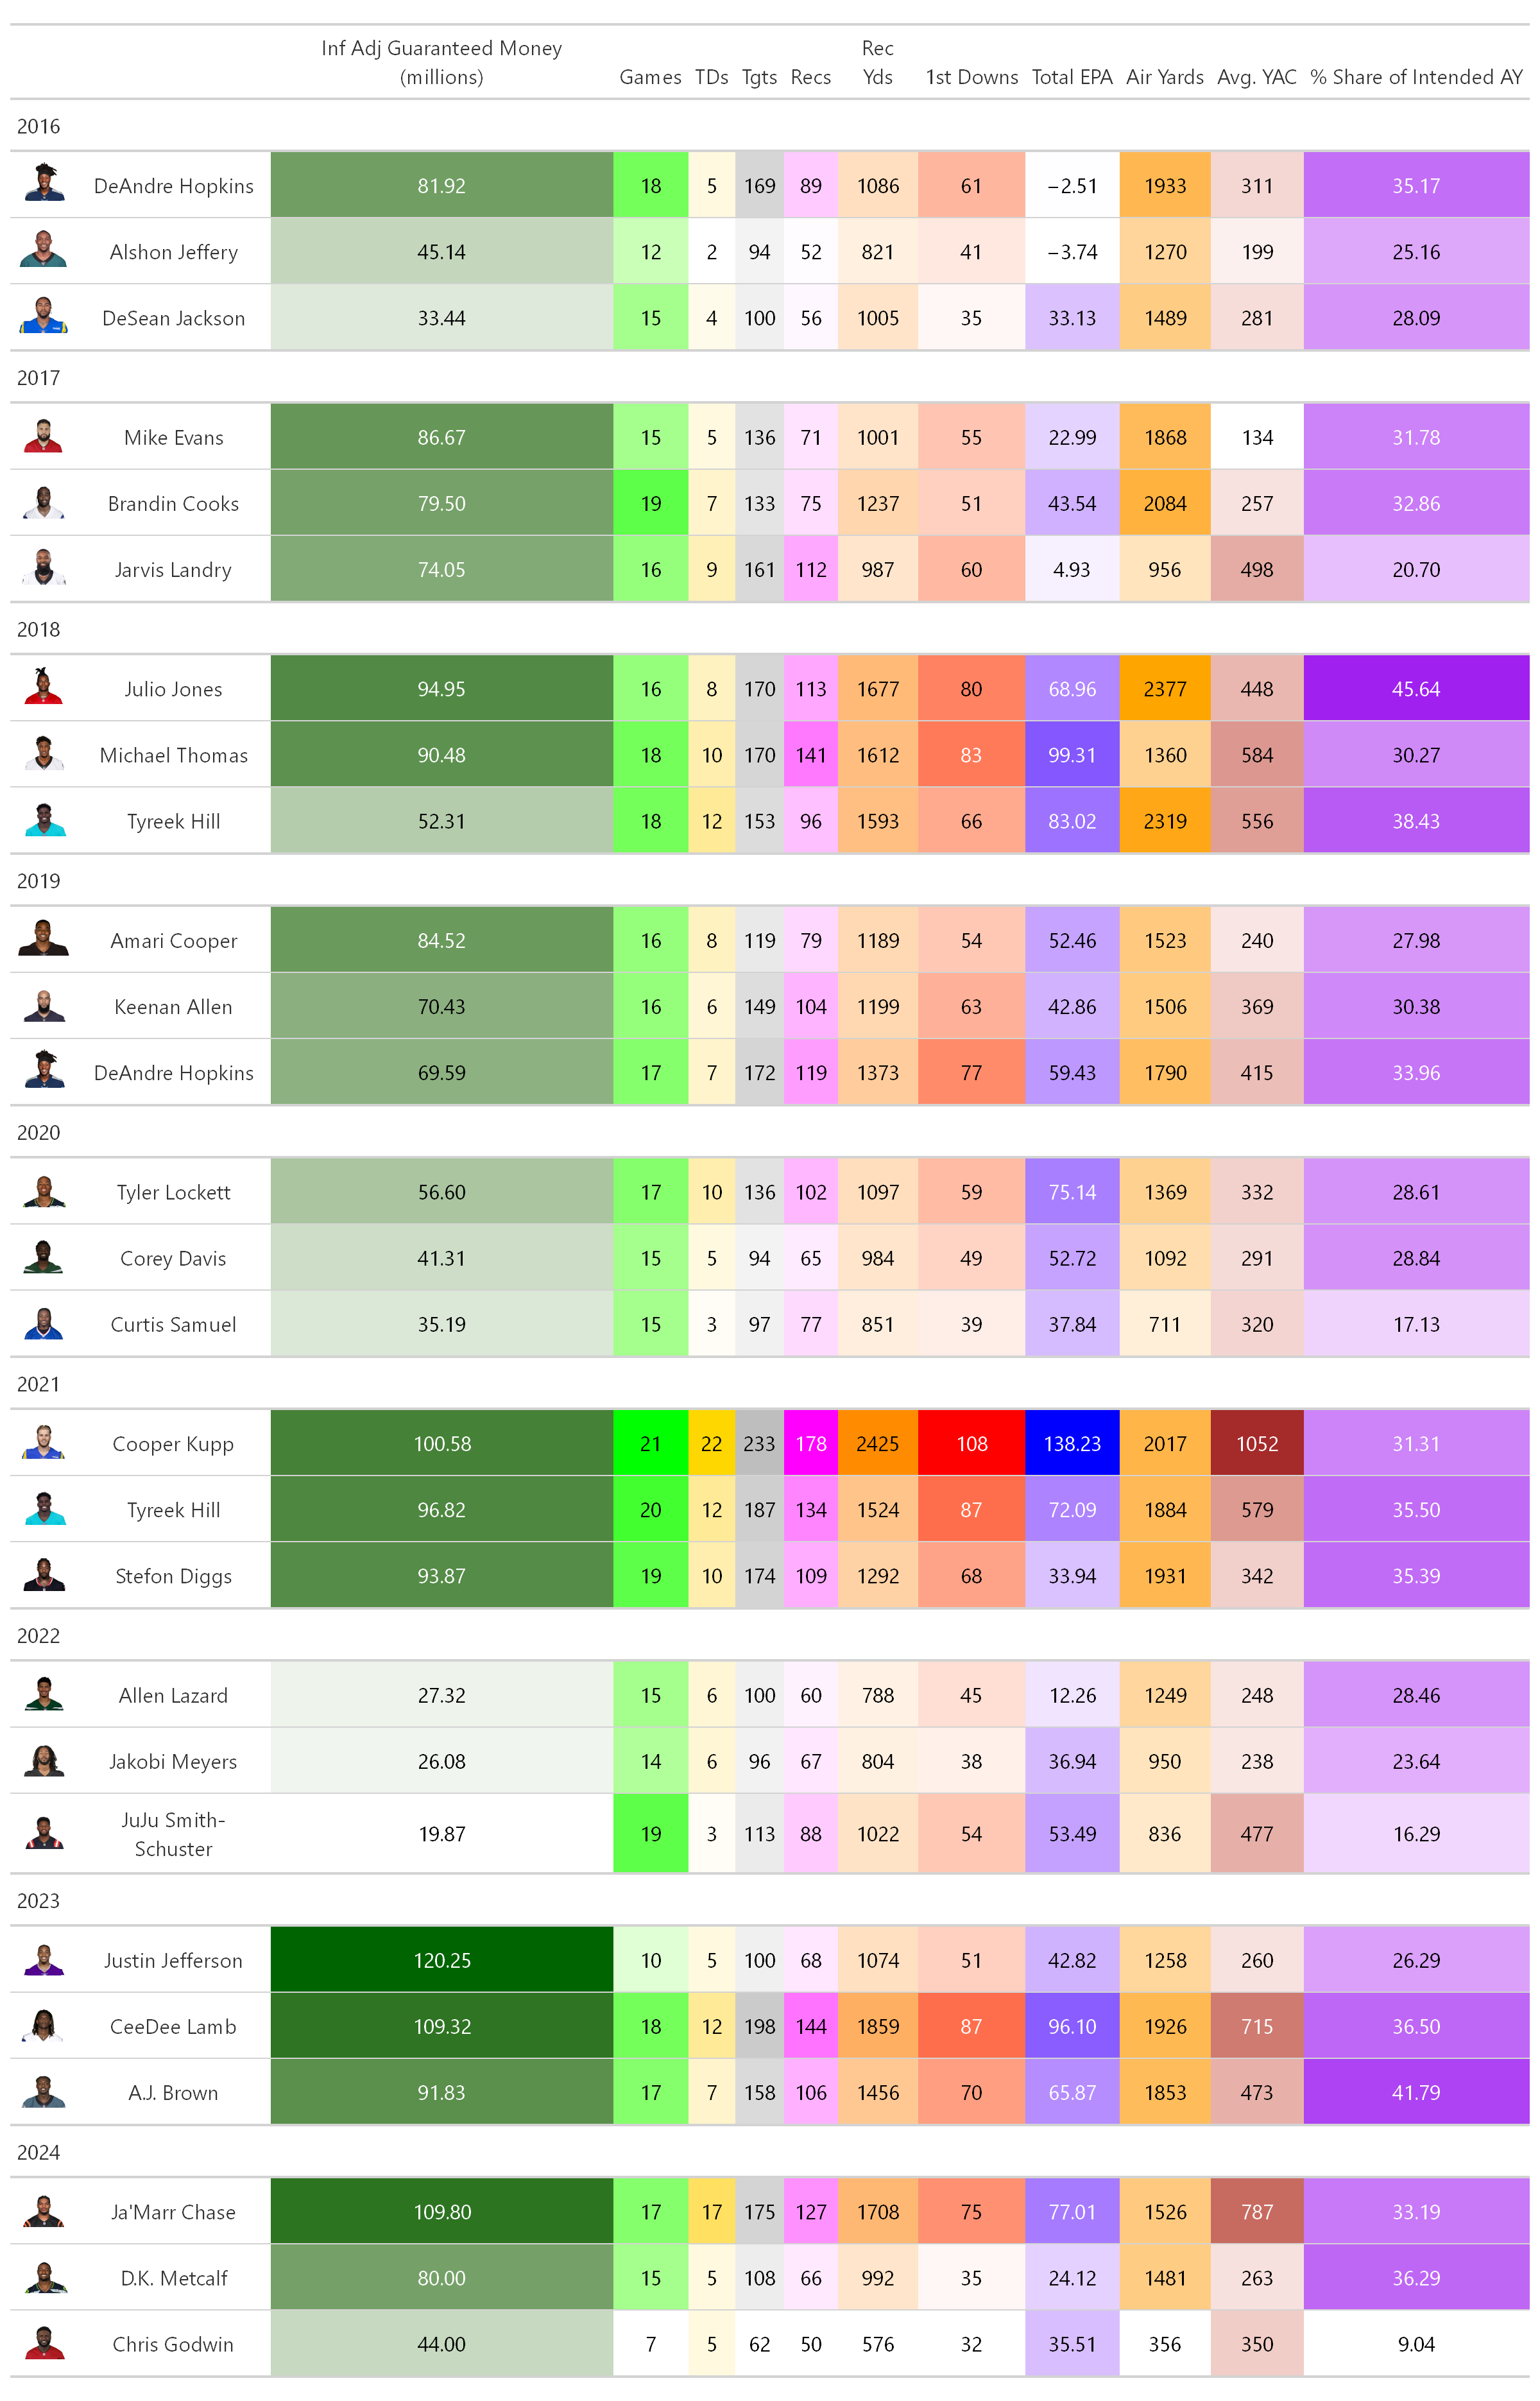
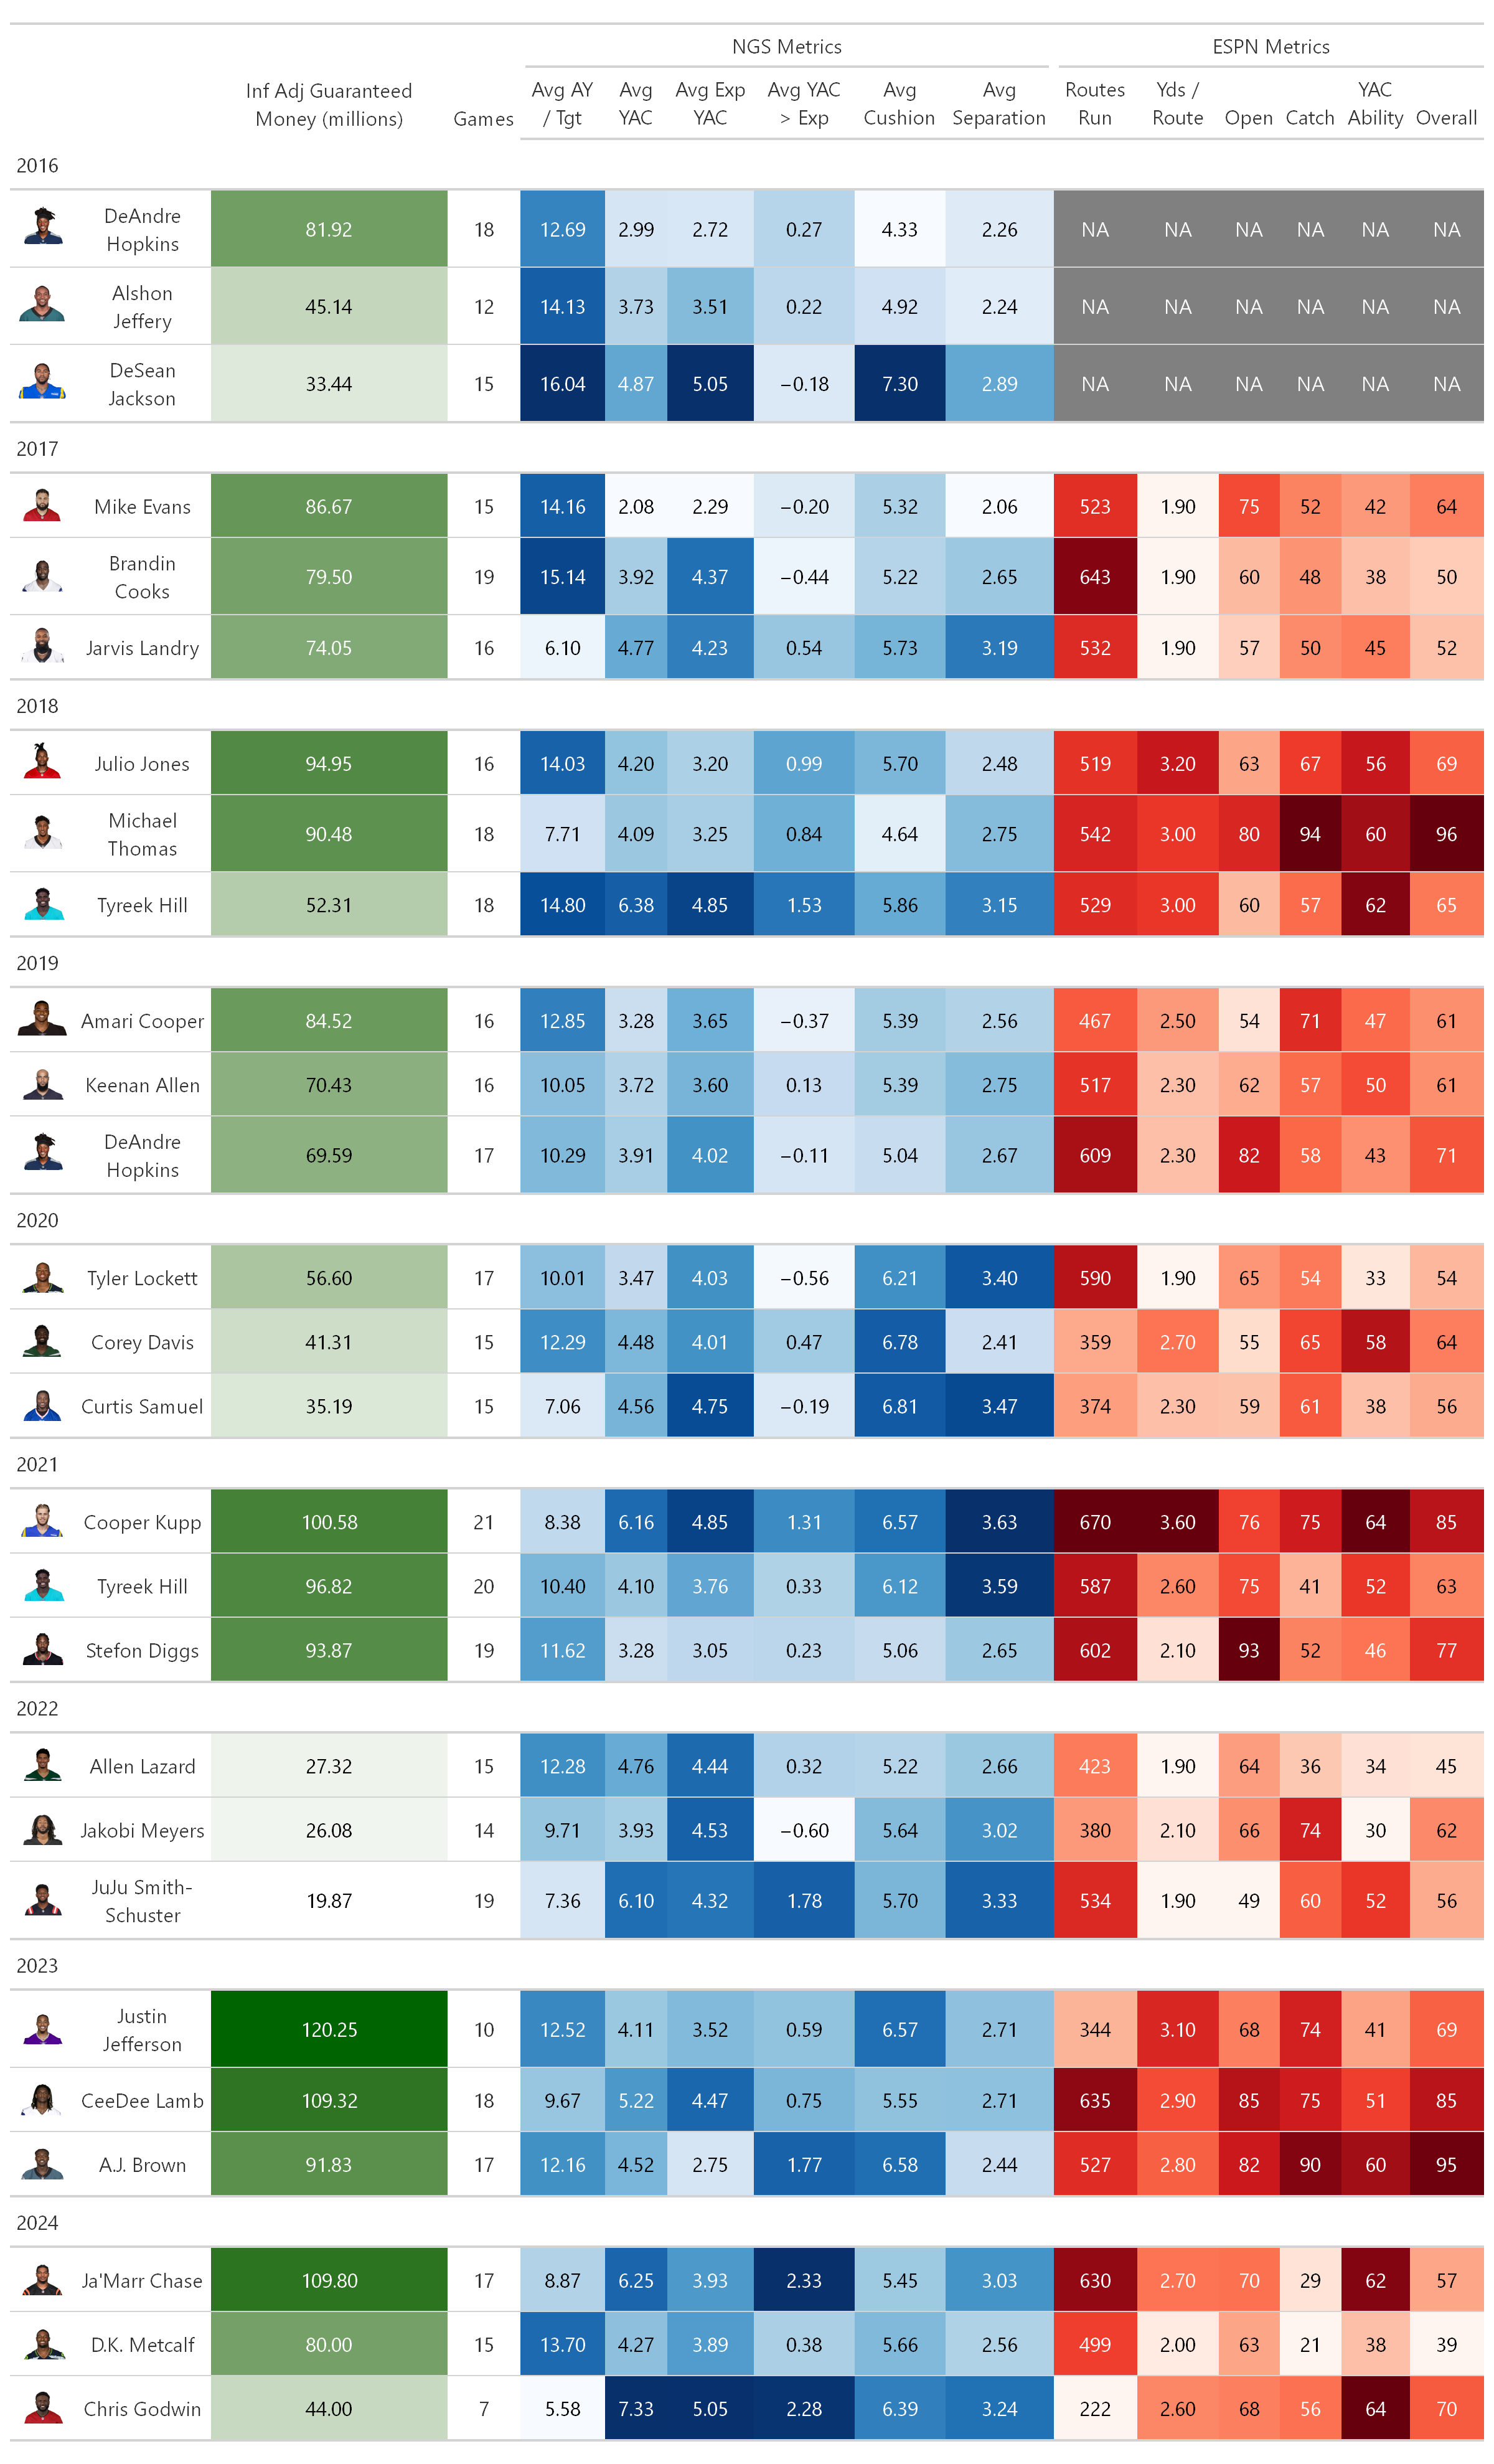
This table is more just to put a face and overall statistical profile to some of the data points. On the season-level, it’s notable to see that, even at the top, guaranteed money paid can fluctuate wildly (max 2022: 27.32; max 2023: 120.25). This would imply that top tier WR talent is perceived as scarce and worth investing money in when confidently identified.
On a player level, it makes sense to see Cooper Kupp get rewarded after a triple crown (1st in receptions, yards, and touchdowns). The Justin Jefferson contract demonstrates that missing substantial time during the season due to serious injury does not preclude you from earning at the highest level.
Rate Metrics
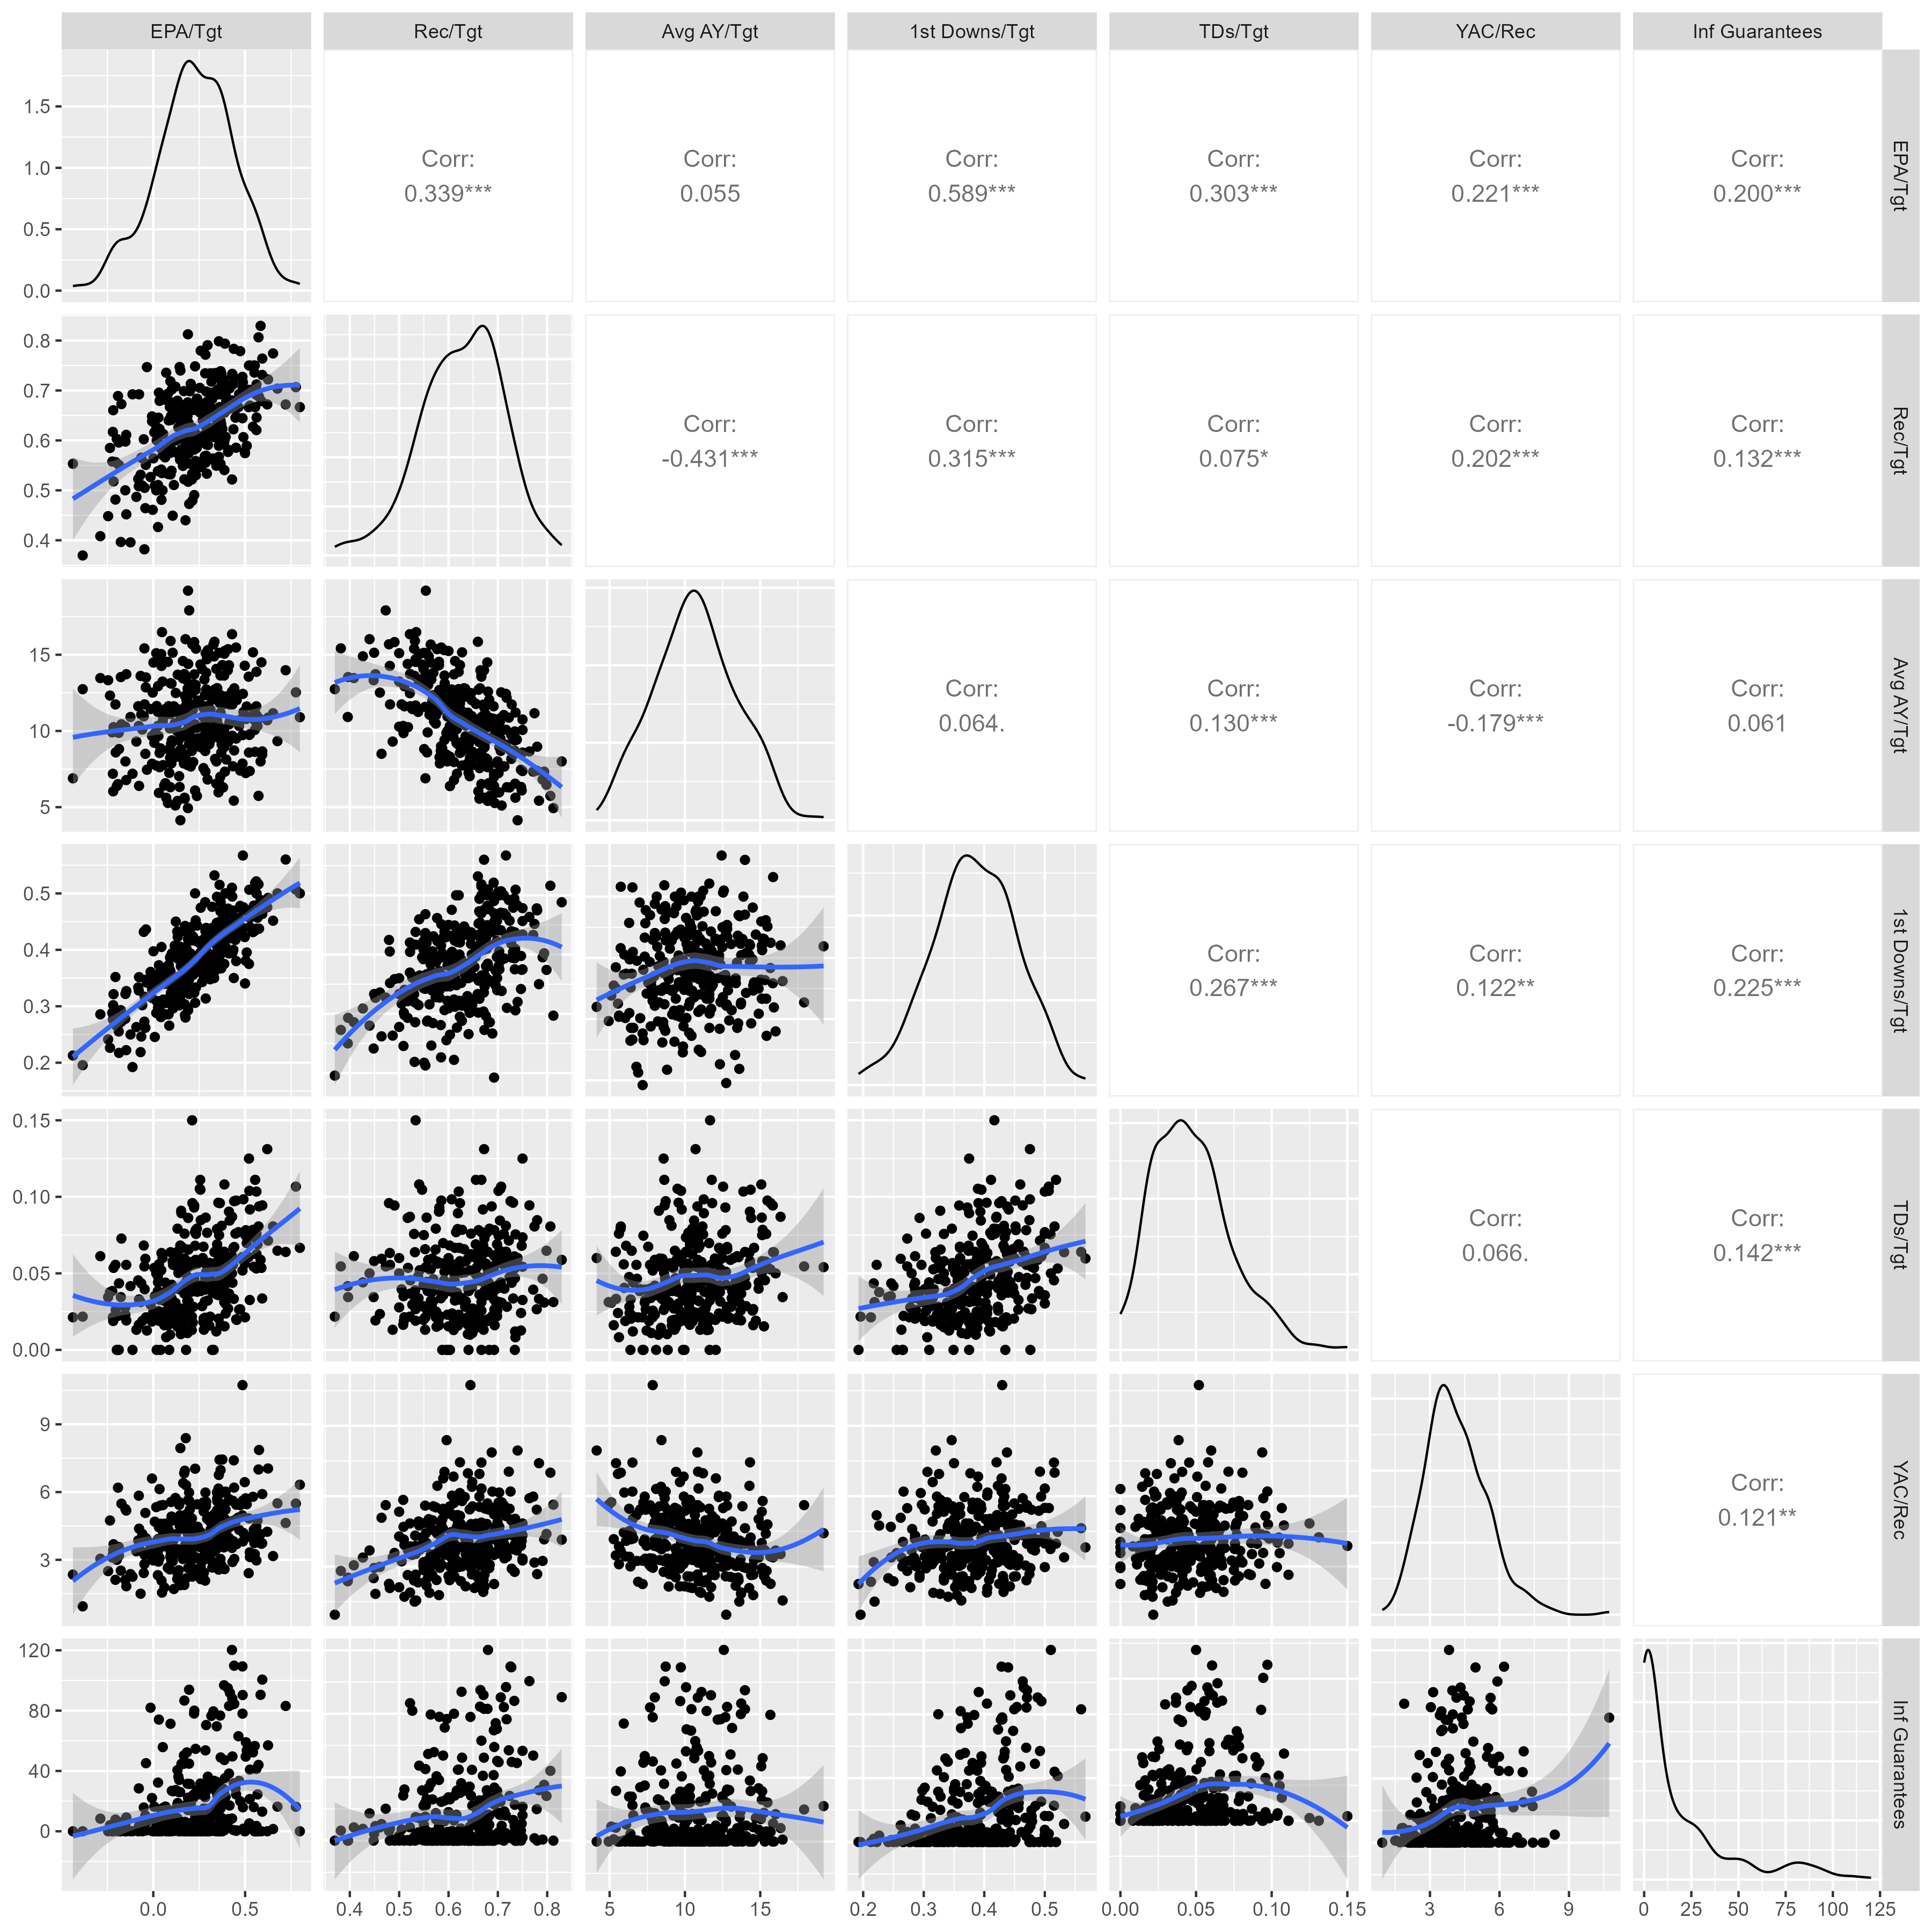
When decoupling volume and focusing specifically on efficiency, the correlations with guaranteed earnings dropped considerably (right column). First downs per target and EPA per target showed the highest correlations, registering above 0.2, while the other efficiency metrics logged correlations less than 0.15.
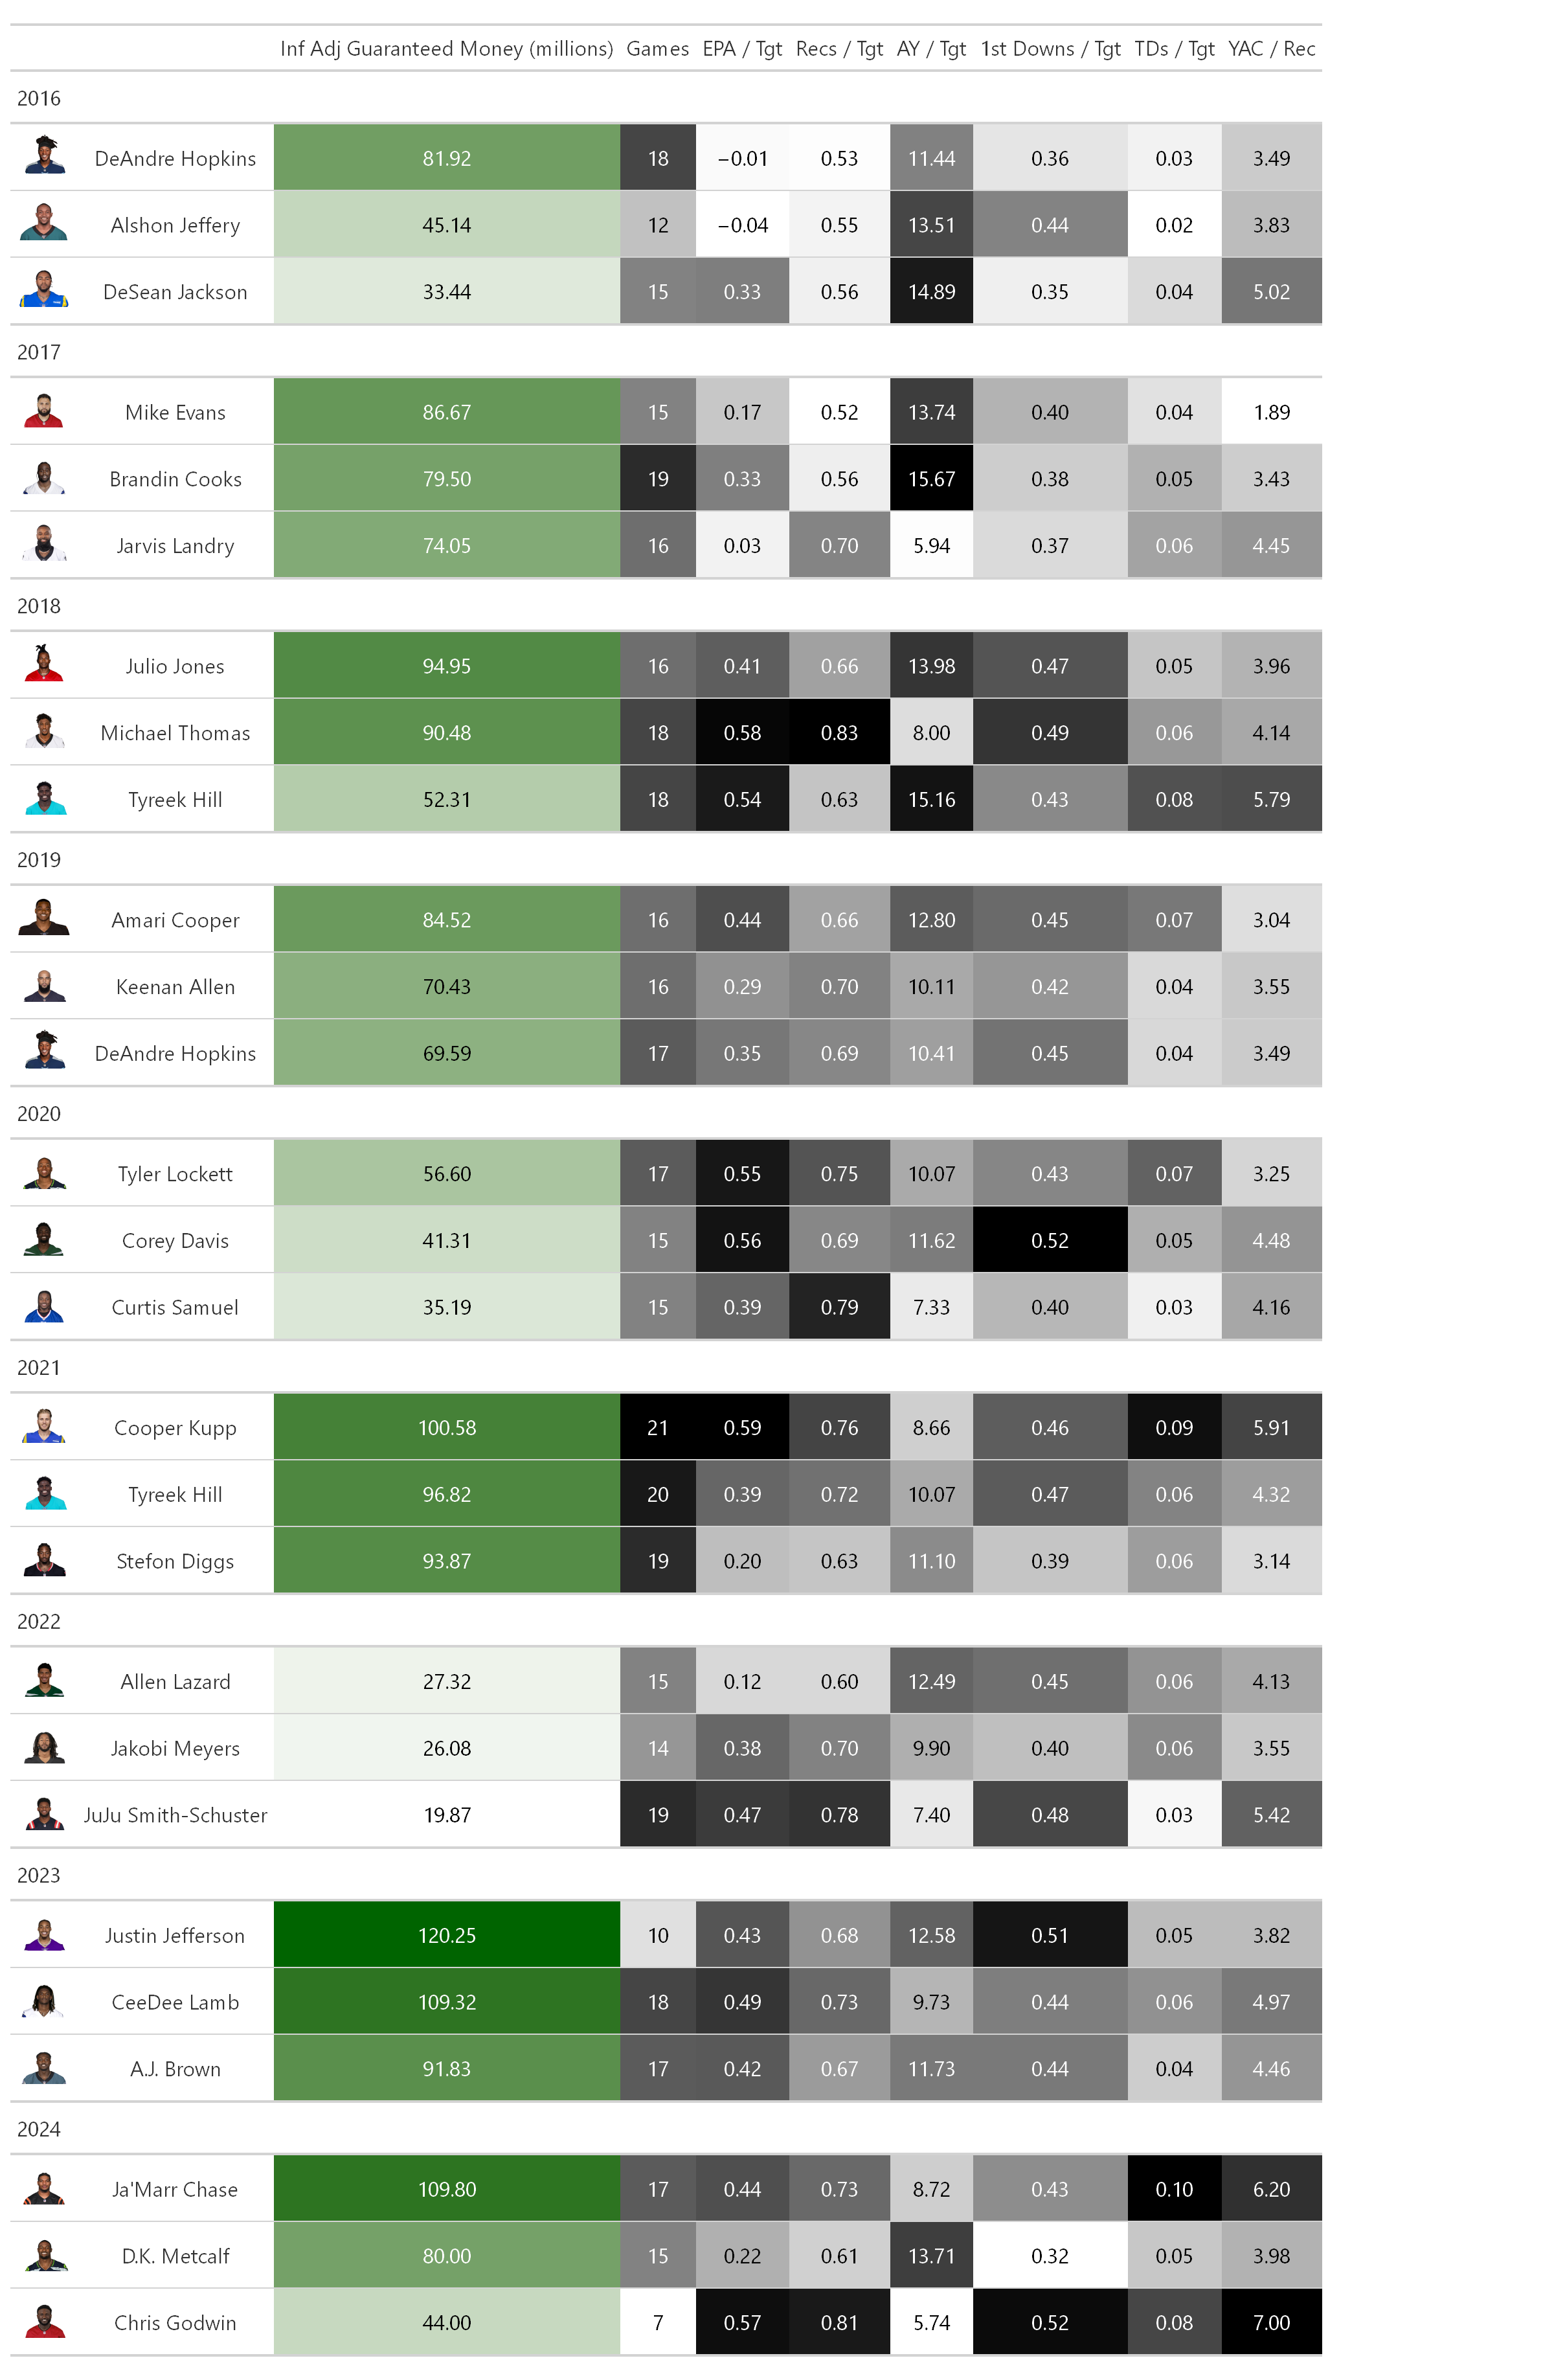
Even after accounting for volume, Cooper Kupp’s 2021 statistics still appeared to be among the best. Chris Godwin’s efficiency metrics were also impressive, even in this list, but he only played 7 games before missing the rest of the season with a dislocated ankle.
Location-Derived Metrics
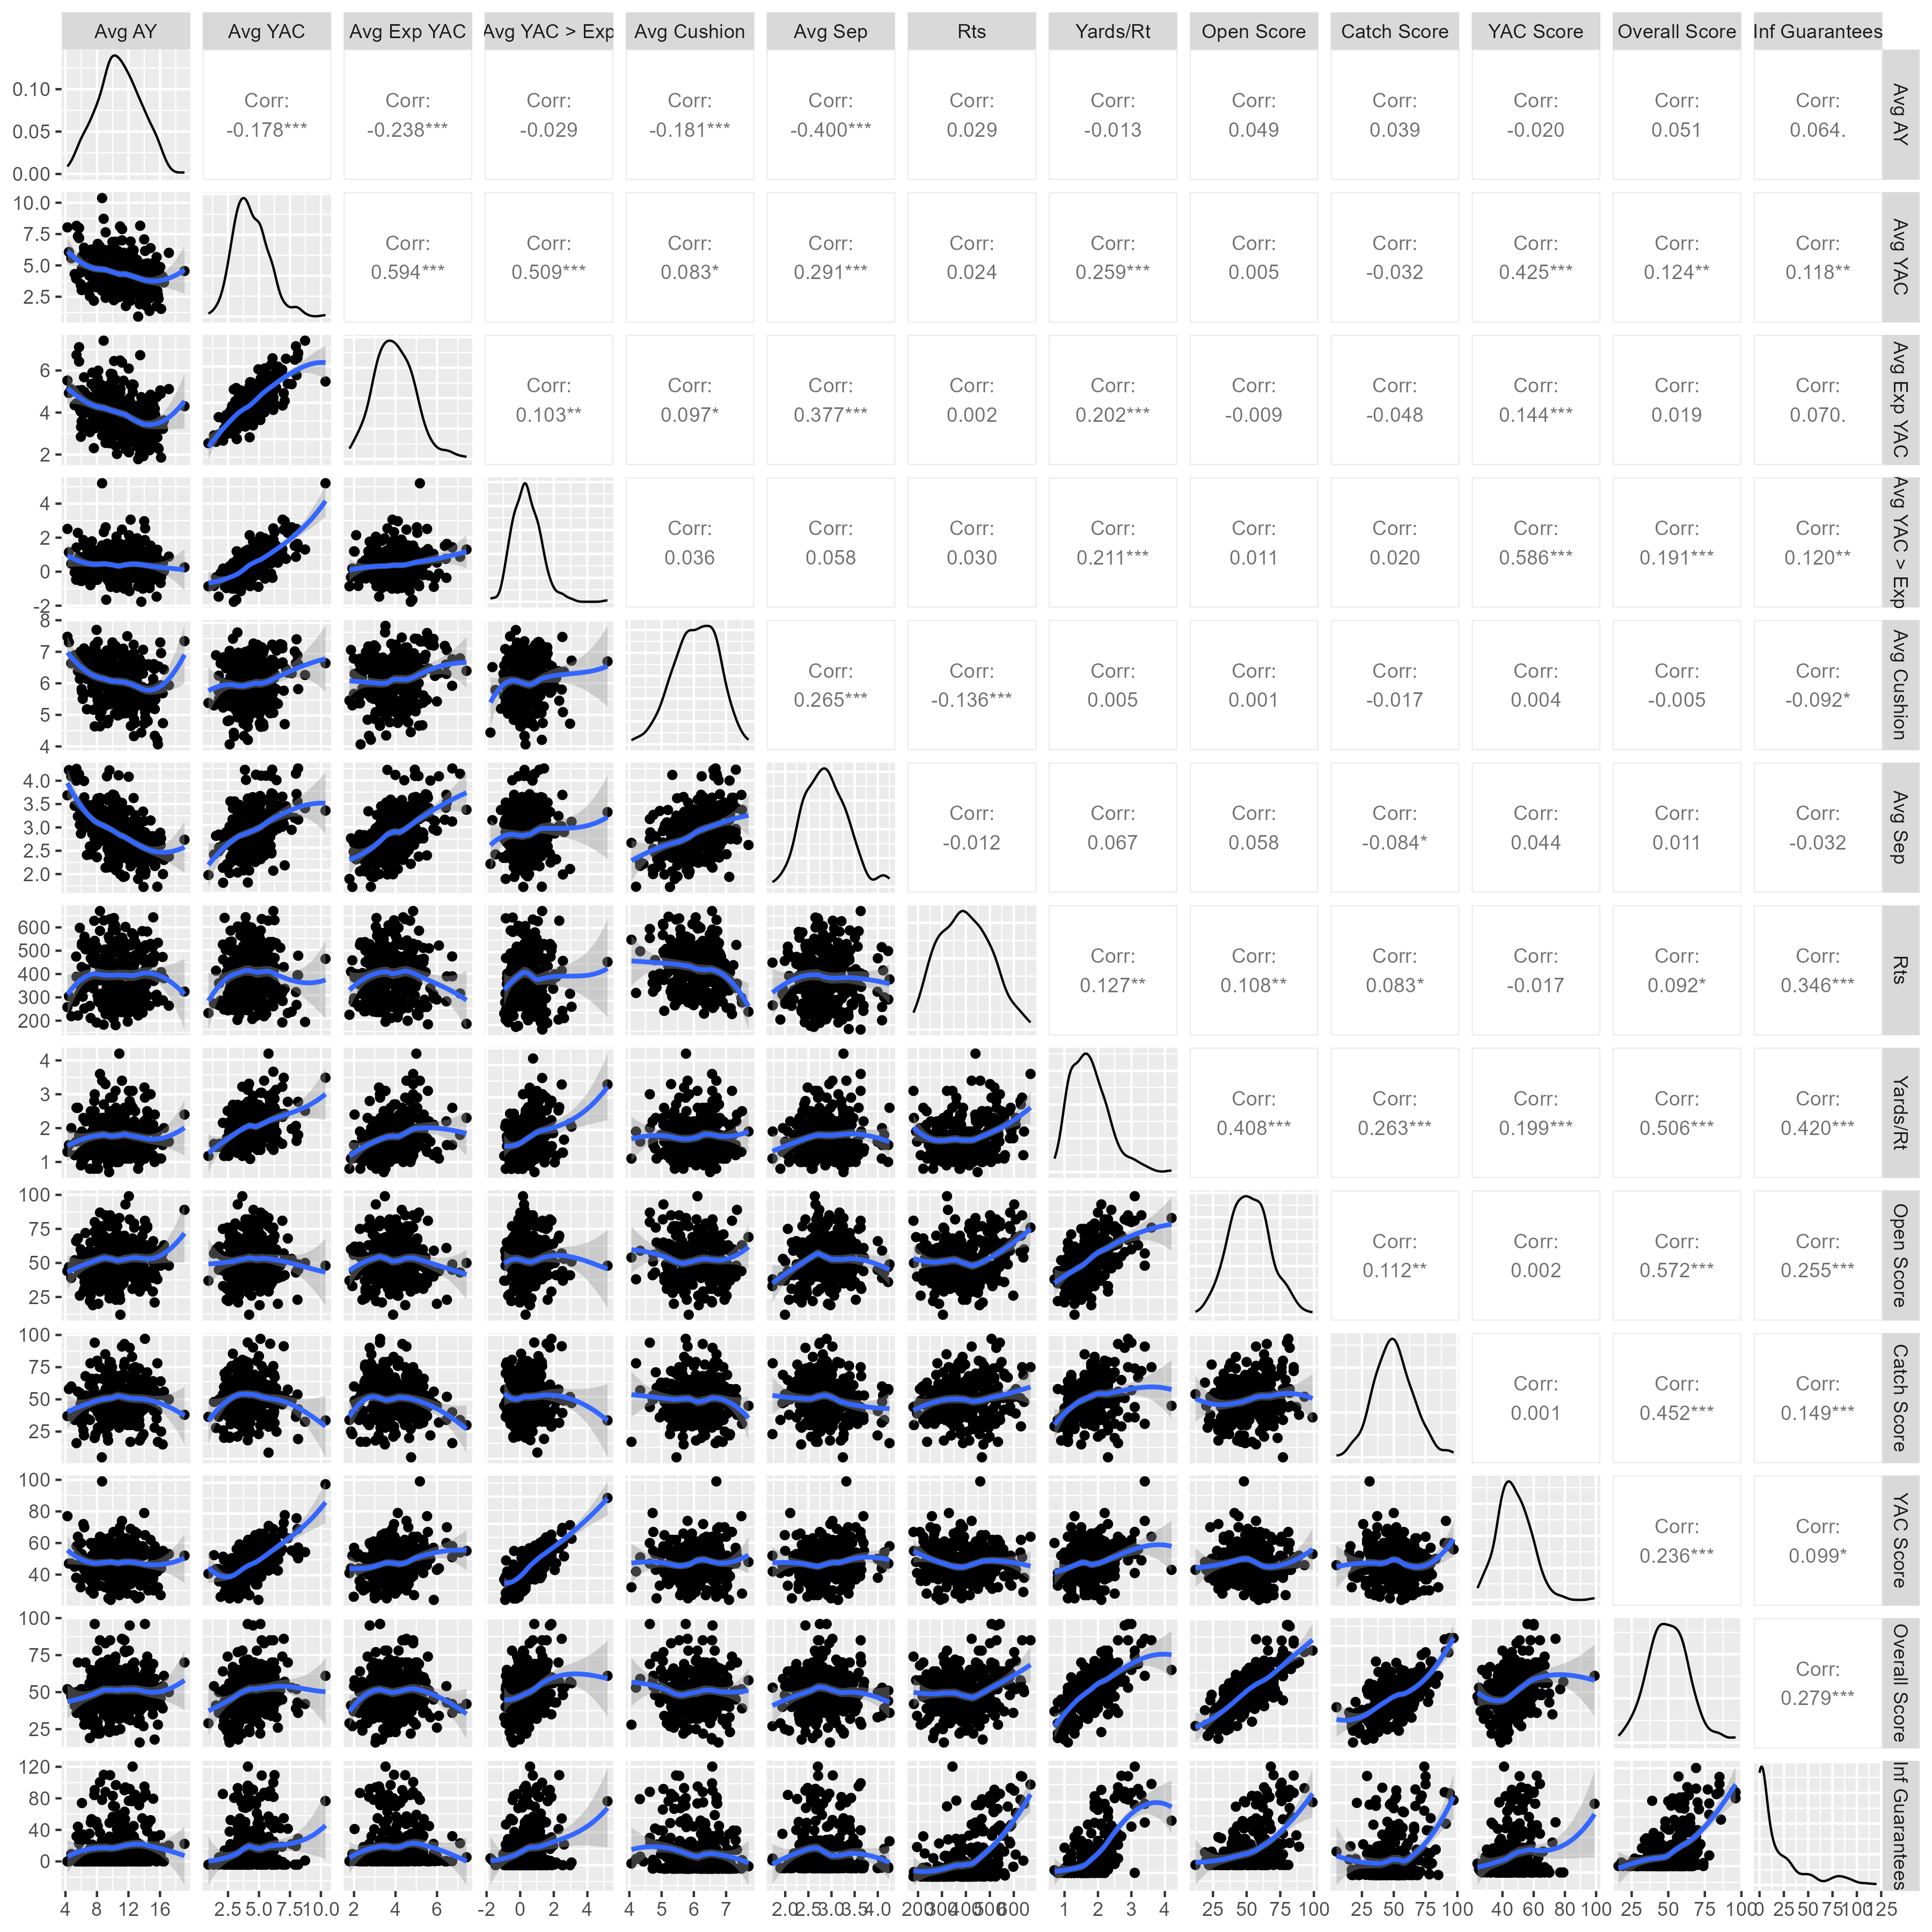
Among the NFL NGS player tracking metrics, the volume metrics were most strongly associated (yards per route run: 0.42; routes: 0.35) (right column). For the ESPN-extracted metrics, overall score and open score showed similar correlations (overall = 0.28; open = 0.26), while catch and YAC score correlations fell lower than 0.15.
Closing Remarks
Seeing the cumulative statistics be most strongly related to future contract guarantees is no surprise. Those statistics aggregate both usage and efficiency to a degree where better players should produce more. I would say that a weaker association that caught me off guard was for EPA. Considering the fact that EPA more directly links to point scoring, putting more weight in higher leverage catches like first downs, touchdowns, and big gains, placing more importance on those who are able to produce in that metric might prove valuable for team building purposes. The counter argument (and [common refrain](https://www.nfeloapp.com/analysis/expected-points-added-epa-nfl)) is that it’s difficult to untangle EPA contributions by receivers from that of the QB or the offense at large. For example, the top two guaranteed money payouts for 2017 were DeAndre Hopkins and Alshon Jeffrey, who are at very least, talented wide receivers. But you couldn’t tell from their EPA totals, which were actually negative in the prior season, impacted by substandard offensive play from the 2016 Texans (QBs: Brock Osweiler/Tom Savage) & Bears (QBs: Cutler/Hoyer/Barkley), respectively.
I was also a bit surprised that, even weighting for the number of targets, the relationships to the per target metrics were markedly weaker. A fair bit of that relationship is likely a manifestation of “the best ability is availability” adage. Lower volume might be indicative of some level of injury-proneness, which would make for a riskier investment. It could also be because a receiver is better in specialized use cases, and lacks the talent and/or skill to execute on a larger scale. Otherwise, higher volume does help convince decision-makers that any good performance they’re seeing is “sticky”.
Coming into this, I had thought that expected YAC would be related to separation, and indicate that a receiver was good at creating space and outrunning players assigned to cover them. However, these two metrics are correlated quite negatively with air yards, implying that higher average separation is more a result of schematic design where passes are caught close to, if not behind, the line of scrimmage. Given that, it might be less indicative of overall talent, though there might a specific archetype of player that handles those. A robust discussion of these statistics have been posted by Sumer Sports,
What we haven’t considered:
Attractiveness of club outside of guaranteed compensation (e.g. stability of staying on the same team, championship competitiveness)
Length of contract, yearly salary, and other forms of compensation (e.g. performance incentives) built into the contract
Age, injury history, performance history in prior season(s), playoff performance, and other player factors (e.g. draft position, physical measurables)
Contributions of player beyond typical measured statistics (e.g. leadership, blocking, marketability)
Available money under the salary cap for teams that would be interested in their services
How the availability of other options in the marketplace (or lack thereof) impacts demand (e.g. draft class, presence of other free agents related to who’s contracts are expiring and who was available when the signing took place)
I’ve also just pulled one year of data, and while “what have you done for me lately?” should apply here, good performance in prior years should contribute to club willingness to give guaranteed money. Additionally, some of this guaranteed money was awarded on contracts signed during the season, so decision-makers would have more recent data to influence their decision in these cases.
Unsurprisingly given the above, a multi-factorial model would be needed to get a better estimate of the degree to which wide receiver performance contributes to a team’s willingness to provide guaranteed money. Such a model could be helpful in determining framing negotiations from either the NFL or player side, or to identify areas of production that might be garnering more or less money than is warranted.