Prediction, specifically the prediction of football player productivity, is the literal heart of the game of fantasy football. And as the game has grown, the development of fantasy point prediction models have unsurprisingly followed. Of course, as no model is perfect, players under- and overperform those model predictions. Analysts often use large over- and under-performance as a sign of unsustainable play, and expect that many of these players will regress back towards the mean given a long period of time.
But surely there must be some players that buck that trend to be consistently extraordinary (or consistently extraordinarily bad) in a way these models don’t account for. Perhaps it’s because they are exceptional talents, or perhaps it’s because they’ve been married with a quarterback and/or offensive playcaller that understands and best utilizes their strengths. For underperformers, the opposite could be true. Below, I look to identify those players, creating data visualizations to highlight which players consistently generate more or less fantasy points than expected season-to-season, and discuss why that might be the case.
Objective
1. Employ data visualization to see which wide receivers consistently do better or worse than models built around WR usage would predict
2. Combine those observations with other metrics of wide receiver ability and situation to contextualize the patterns observed
Data
Data on expected points and points over expected originated from Mike Clay’s articles on ESPN.com. Season-level data were available for the 2022-2025 NFL seasons, with partial data (6 weeks) from 2026 also included just to see where the incomplete data were leading. Some name editing was required to promote consistency across seasons. The metric of interest was Fantasy Points Over Replacement per game (FORP), which is defined as the actual fantasy points scored minus their expected fantasy points.
To reduce the influence of small sample sizes on summary statistics, I filtered out season observations for players with less than 5 games and 20 receptions. FORP values were plotted over all qualifying seasons, with a focus on median values to reduce the influence of outliers. In visualizations focusing on a player who changed teams midseason, stats were combined across the whole season. While excluded from summary statistics, 2026 FORP was also included, with receivers playing at least 2 games and making 5 receptions deemed “Active”.
To further investigate which aspects of receiver performance might most strongly impact, I linked the data to ESPN’s Receiver Tracking Metrics, which strives to parse out performance in 3 different phases: getting open (Open Score), catching the ball (Catch Score), and creating yards after the catch (YAC Score). They also report an Overall Score metric. With this data, I can try to gauge which of these abilities is most important in overachieving in the eyes of fantasy players. For this ESPN data, I utilize the combined data for ’22-’26. Comparisons with wide receiver metrics compiled by Sumer Sports were also used for additional reference.
Results
Player Population
189 players had qualifying seasons during the time period available, with 124 recording more than 1 season in the timespan examined. Qualifying player seasons totaled 431, and averaged about 15 games played and 51 passes caught. 86 players also logged at least 2 games and 5 receptions in the current season. For 100 of the players identified, the ESPN Analytics Receiver scores were also available.
The inputs used to predict WR fantasy points were quite informative for the model, whose predictions left only 10% of the variance unexplained. Now, that does require exact knowledge of how many passes each receiver was thrown and how far, among other things not predictable pre-game. Still, it is a strong demonstration of just how important throw distance and location are.
Player Median FORP
42 players produced positive FORP in all of their qualifying seasons, though 21 did so with only 1 qualifying season in this period. Conversely, 71 players never produced a season with positive FORP in the time period, but 44 of those only made single season appearances in the dataset.
Once the data is limited to current players, 23 avoided a negative FORP season, though On the other side, 20 never left the red from 2022-2025, with 11 only qualifying in 1 season.
Table 1. Breakdown of Wide Receivers Consistently Overperforming, Underperforming, or Neither
| Pattern | All Qualifying Players | Active Players |
|---|---|---|
| All Seasons Above Expected | 42 (22%) | 23 (29%) |
| Mixed | 76 (57%) | 43 (51%) |
| All Seasons Below Expected | 71 (27%) | 20 (25%) |
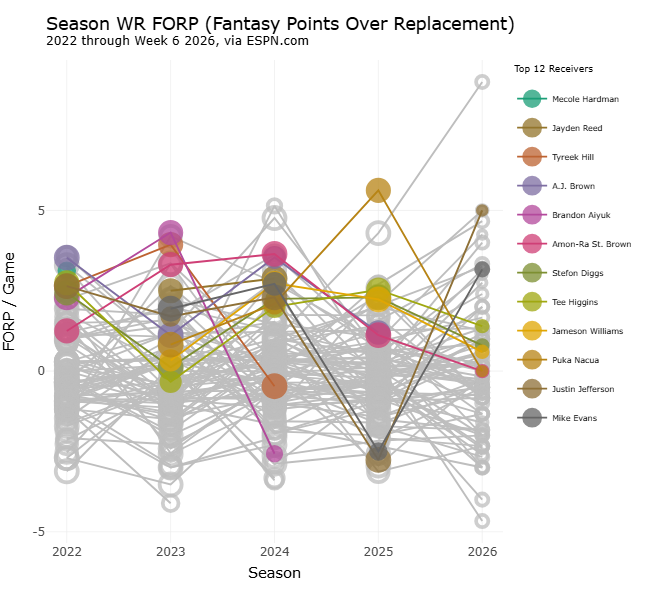
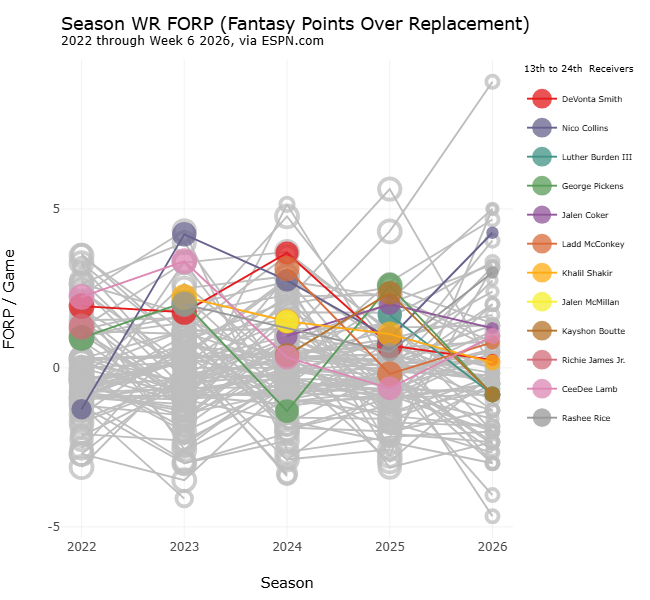
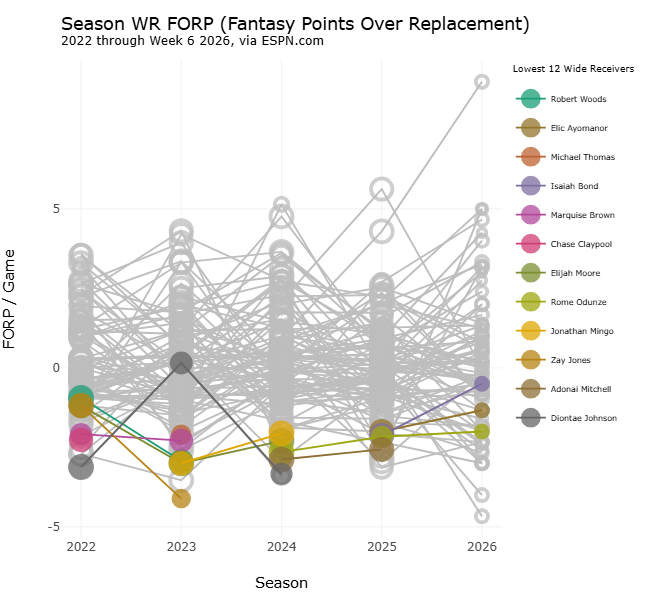
For those interested in seeing the FORP values for those at the top and bottom of the list for the entire dataset, that’s vizualized below and available when you expand the tab below. It does include some interesting names (Get well soon, Jayden Reed. And where have you gone, Brandon Aiyuk??). However, took keep things relatively short, I did want to focus more on those specific for the active player set, so I’ll go into detail with those further down.
Click to show plots
Top 24 by Median FORP
Figure 1. FORP by Season for (A) Top 12, and (B) 13th-24th Wide Receivers
Bottom 24 by Median FORP
Figure 2. FORP by Season for (A) Bottom 12, and (B) Bottom 13th-24th Wide Receivers
Active Players
The top 12 is an interesting mix of receivers at first glance. There are tenured and well respected #1 receivers (e.g. Justin Jefferson, Mike Evans), but also those serving in the #2 role (e.g. Tee Higgins, DeVonta Smith, Jameson Williams). The Top 24 appearances of the top 3 Lions receivers, Amon-Ra St. Brown (ranked #1), Jameson Williams (#4), and Kalif Raymond (#18). The Vikings pair has also shown quite well in this metric, with Justin Jefferson landing at #6 and running mate Jordan Addison clocking in at #20. Other efficient pairings were more short-lived and include players who have played on multiple teams during this period, like George Pickens with CeeDee Lamb and Ryan Flournoy on the Cowboys, and Stefon Diggs with Khalil Shakir on the Bills, Nico Collins on the Texans, and Kayshon Boutte on the Patriots.
Figure 3. FORP by Season for (A) Top 12, and (B) 13th-24th Wide Receivers Active (by Week 6, 2026)
B.
Among the top 24 active players by median FORP in prior seasons examined, 9 of them had 1 season where they actually recorded fantasy points below expectation, with one player, Luther Burden, unable to because he had only one qualifying season. For that same group, 17 also were in positive territory through 6 weeks of the 2026 season.
Adjusting the lens slightly, among the 23 players consistently logging a positive FORP in all their prior seasons, 13 have a positive FORP thus far this season. 11 of the 17 with more than one season continued their positive FORP pattern. That is slightly more than you would expect if (binomial test p=0.17).
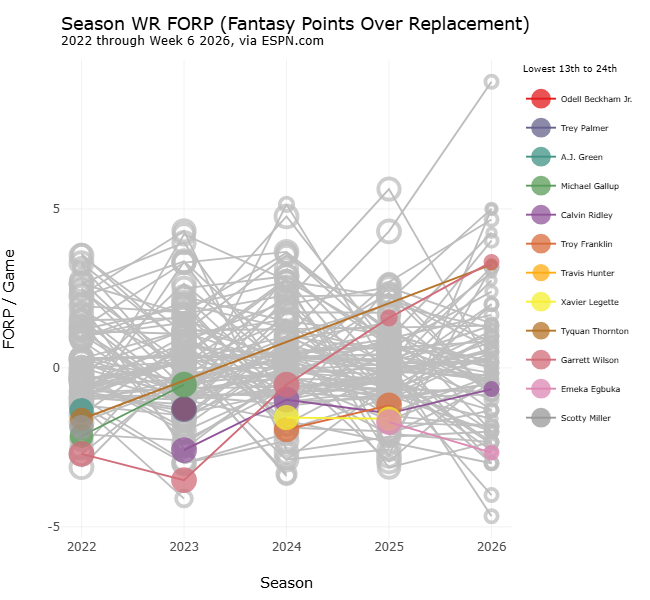
For the bottom 24 players by median FORP, 7 did at least record one positive FORP season, while another 9 were restricted by having only one qualifying season to begin with. This season, 16 are still performing below FORP.
Figure 4. FORP by Season for (A) Bottom 12, and (B) Bottom 13th-24th Wide Receivers Active in 2026 (Week 6)
B.
Among the underperformers, inefficient pairings were harder to notice, though there seems to be more one year qualifiers and players changing teams, likely because of that underperformance. Skyy Moore and Xavier Worthy didn’t have much overlap, but did both play for mutliple years in Kansas City with in the Andy Reid offense with Patrick Mahomes, so it’s interesting to see them both not getting a lot out of their opportunities. Jerry Jeudy and Courtland Sutton have both seemingly made less of their opportunities than average during their time with the Broncos.
Of the 20 who never had a positive FORP, 15 still aren’t in positive territory this season. Among the 9 players who have never recorded a negative FORP in at least 2 prior qualifying seasons, 8 are in the negative this season, easily more than you would expect by chance if the prior negative FORP had no predictive ability (binomial test p = .02)
Regarding the degree of predictiveness that previous FORP patterns were for 2026, I will say that similar, more rigorous examinations using prior 2- or 3-season periods to predict the full season after, when eliminating double counting of players, showed only small but statistically unconvincing elevations in likelihood of pattern continuation.
Table. Concordance between Wide Receiver Over/Underperformance for a Season and its Prior Seasons
| FORP Before/After | ||
|---|---|---|
| +/+ | -/- | |
| FORP Pattern Duration | ||
| Prior 2 Seasons | 16/28 (p = 0.26) | 7/11 (p = 0.27) |
| Prior 3 Seasons | 9/13 (p = 0.13) | 4/7 (p = 0.50) |
When looking at how median FORP per game relates to assessments of receiver abilities, Open Score held the weakest correlation (0.25), while the others (Catch, YAC, Overall) were more strongly correlated at around 0.5.
Table. Correlations between ESPN WR Advanced Metrics and Median FORP (minimum 2 qualifying seasons)
| ESPN Advanced Metric | Correlation |
|---|---|
| Open | 0.29 |
| Catch | 0.54 |
| YAC | 0.48 |
| Overall | 0.59 |
Discussion
As I read it, Mike Clay’s receiver xFP model is built largely around receiver expected receptions, yardage, and TDs based on throw distance and location, and the receiver’s position (e.g. RB, WR, TE). Given that, the likeliest routes to overperformance for a wide receiver should be through some combination of above-average catching ability and accomplished route running to create separation to make catches easier, and creating exceptional yards after the catch. But given that information, my impression previous to this analysis was that VORP would still be closely tied with offensive scheme and other personnel, and that we would see more teammates clustered at the top. I figured that specific teams would simply be better able to get create advantageous situations around the throw and catch that wasn’t accounted for by the model. However, we didn’t see that, for the most part, with the Lions and Vikings being the only consistently high VORP pairs currently in place. And while #1 receivers are definitely well represented, the presence of longer-term #2 receivers like Tee Higgins and Devonta Smith point to the fact that other broad roles in the offense can still accomodate consistent overperformance. Still, I’m surprised I didn’t see more receivers further down the pecking order, but it could just be the case that talent really does quickly rise to the top, maybe elsewhere if not on their current team.
But now I’ll return focus to those 3 WR traits, which mapped to the ESPN Receiver analytic scores. Per the receiver metric correlations, Catch score showed the strongest relationship with FORP, albeit marginally better than YAC score. This importance seems to persist at the top of the FORP list–of the 12 highest FORP players, 6 (St. Brown, Diggs, Nacua, Pickens, Smith, Coker) were also top 24 in 2025 catch rate (minimum 250 targtes), despite most having a moderate depth of target. We see a similar pattern on the other end, with the observed underperformers (e.g. Mooney, Bond, Mitchell, Odunze, and Ayonmanor) also logging quite low catch rates low catch rate players. It can’t be surprising, since it’s hard to score any fantasy points as a receiver if you don’t actually catch the throws that come your way. My instincts are quarterback inaccuracy contributes in this dimension, since there are some questionable throwers attached to many names on this list of underperformers. There are also players quite high in average depth of target (e.g. Tyquan Thornton, Malik Nabers, Treylon Burks). That might indicate that receivers that play a field stretching role might suffer in the eyes of the model if they’re getting a greater proportion of poorly thrown or performative deep balls.
The FORP-YAC ability relationship looked similarly close for over-performers, with 5 of the top 12 FORP receivers (Williams, Jefferson, Nacua, Pickens, St. Brown) also top 24 in YAC per catch (minimum 250 routes run). However, that relationship seems less evident at the other end, with only 2 of the bottom 12 also posting bottom-24 YAC/C numbers. Unfortunately, there isn’t a readily available stat to parallel Open score. But it’s worth nothing that, while Open score seems less important than other receiver dimensions in predicting fantasy points according to the correlations, FORP is only calculated based on actual targets thrown. Opportunity should still be solidly dictated by whether a player can get open, or they won’t draw a FORP-registered target in the first place. I would expect it to be a stronger predictor when accounting for overall routes run by a receiver.
Closing Remarks
After all that, I’d say we only have fairly limited evidence that FORP can be persistent for some players. This probably speaks to how swiftly fortunes can change, whether it’s an injury that compromises performance for an extended period of time or an unfortunately new pairing with a green quarterback like with Justin Jefferson. Still, in a consistent environment, talent does have an opportunity to shine through and shine on.
Multi-season FORP, at least as defined by Mike Clay’s model, seems to be more closely linked to higher catching skill, followed closely by post-catch elusiveness, as assessed through ESPN’s receiver analytics. Given that, for fantasy players, looking at different veteran receivers, selecting one with some history of overproduction and better catch ability could be the more reliable choice.
As always, there are some caveats to note. The analyses and visualizations do rely on the supposition that there haven’t been changes to the expected fantasy point model in the years I explored. The descriptions of the data seem stable across the years, so hopefully that is an appropriate supposition.