Hitting a game-winning homer is a classic childhood dream. But for me, most of my childhood baseball fantasies came not with a bat in hand, but from the mound. In my imagination, there’d be few things more satisfying than having “stuff” so mind-bending, hitters could do little more than gawk in stunned silence as the ball idled to just the right spot, and walk back to the dugout in ignominy.
Cut to the present, and my best “stuff” is the Double Stuf Oreos pack stashed in my pantry, but I remain awed by the skill of the pitchers today. While watching, I do still wonder, with the vast array of pitches at their disposal, which are the ones that best freeze a batter in place? Are they the fastest ones that leave precious little reaction time and little hope of contact? Or perhaps those with such bewitching rotation that a hitter has no faith in predicting where it will end up? Inspired by Julia Silge’s exercise in home run prediction, as well as some other tasks I’ve been involved with, I engaged in a bit of machine learning to come up with an answer.
Which Pitches are Most Effective in Netting Called Third Strikes?
Data
Baseball has long been at the forefront of sports analytics, and the current built-in infrastructure (e.g. multiple high-FPS Hawkeye cameras) for data collection and reporting is nothing short of impressive. Statcast is particularly useful because it collates an impressive array of variables related to each pitch thrown in the major leagues. The R package baseballR has some handy functions to query data frames from the Baseball Savant interface.
The Baseball Savant database conveniently pairs the observed physical pitch characteristics (spin rate, location) with situational characteristics like current count and score. With all this pitch-level data available in one place, it shouldn’t be difficult to train a prediction model.
A little background research tells me that the decision to swing is made in the first 100 milliseconds. As such, the hitter has to identify a pitch to some extent by its exit velocity, perceived rotation and release location. Once a guess is made, the hitter must then decide if it’s worth swinging at based on where they think it will end up based on their prior knowledge from scouting reports, prior pitches in the game, and to what degree the situation calls for being defensive. I’d imagine an assessment of their own ability to make contact factors in as well.
To promote better predictive ability, the model should be privy to what the batter sees when deciding to swing (ball rotation, release point) as well as ultimate qualities of the pitch itself (location in the strike zone, speed).
Given the fact that pitchers often try to set up batters with specific pitches, it would also be good to ask the question of how influential pitch sequence is, so we’ll look at location and speed of the previous two pitches to get a window into what degree of impact it might have.
Circumstantial predictors should hold some importance as well. The number of outs and runners on base may influence decisions regarding defensive swings. For a pitcher, fatigue and how many times they’ve gone through the lineup may impact pitch quality and pitch choice, which in turn impacts outcomes.
Pitch location at the plate (horizontal and vertical coordinates)
- plate_x, plate_z
Pitch zone location (current pitch location (combined for strike zone & transformed to binary), 1 and 2 previous pitches)
- zone
Effective speed (current pitch, 1 and 2 previous pitches)
- effective_speed
Release location (horizontal and vertical coordinates)
- release_pos_x, release_pos_z
Release spin rate
- release_spin_rate
Spin axis
- spin_axis
Pitch break (horizontal and vertical)
- pfx_x, pfx_z (combined with stand & transformed)
Pitch group (current pitch, 1 and 2 previous pitches)
- pitch_type
Current count
- balls and strikes (combined and categorized)
Current outs
- outs
Current baserunners
- on_1b, on_2b, on_3b (combined and categorized)
Score differential
- home_score, away_score (combined with inning_topbottom & transformed)
Fielding alignment (outfield, infield)
- of_fielding_alignment, if_fielding_alignment
Starter status
- pitcher (transformed using inning)
Pitching workload (at bat, inning, batter, game levels)
- at_bat_number, pitch_number, inning_pitches_thrown, pitches_thrown
Inning
- inning
Day of Year
- dayofyear (calculated)
Home/Road Status
- inning_topbot
Descriptive Variables
For context, our dataset of two-strike pitches started off with 198,967 observations, 80% of which we used for training. Called third strikes occur on approximately 4.5% of those pitches. Four-seam fastballs were the most common pitch (31.7%), followed by sliders (19.4%), changeups (11.9%), and sinkers (11.2%). 42.1% of those pitches found the strike zone.
Modeling
Given a fairly large list of features which can relate to our outcome of interest in a complex ways, a tree-based method seems like a good framework to build our model on. Given the size of the dataset and depth of analysis, I’m choosing a Light Gradient-Boosted Machine because its roots in decision trees allows it to naively ascertain these kinds of relationships. It’s also known handle categorical features, for which we have many, efficiently. That should help ease the workload on my small and aging laptop.
I’ll focus on pitches in the 2023 MLB season specifically as the source of the data, which might be prudent given the institution of the pitch clock that season. I also chose to limit the analysis to 2-strike counts, to minimize the occurrence of batters choosing not to swing regardless of pitch quality, such as during 3-0 counts. So our model will ultimately use Statcast variables to predict the likelihood of a third strike called without a batter swing.
This work was performed in R/RStudio using the tidymodels package. This allows for the automation of some of the data preprocessing, as well as parameter tuning and cross-validation. For lightgbm, I spent a couple iterations of the entire process to tune learning rate, min n, and mtry. To mitigate overfitting, I employed 10x cross-validation. Also, to create a test dataset, I held out 20% of the initial dataset to validate the final model. I chose to focus on optimizing the model’s prediction probabilities, specifically minimize Brier scores instead of mean log loss to reduce the impact of extreme prediction errors. For the best fitting models discovered in training, I checked their predictions against the test dataset and chose the model that scored well for both but did not show strong signs of overfitting.
Final Model and Predictions
Important Predictors
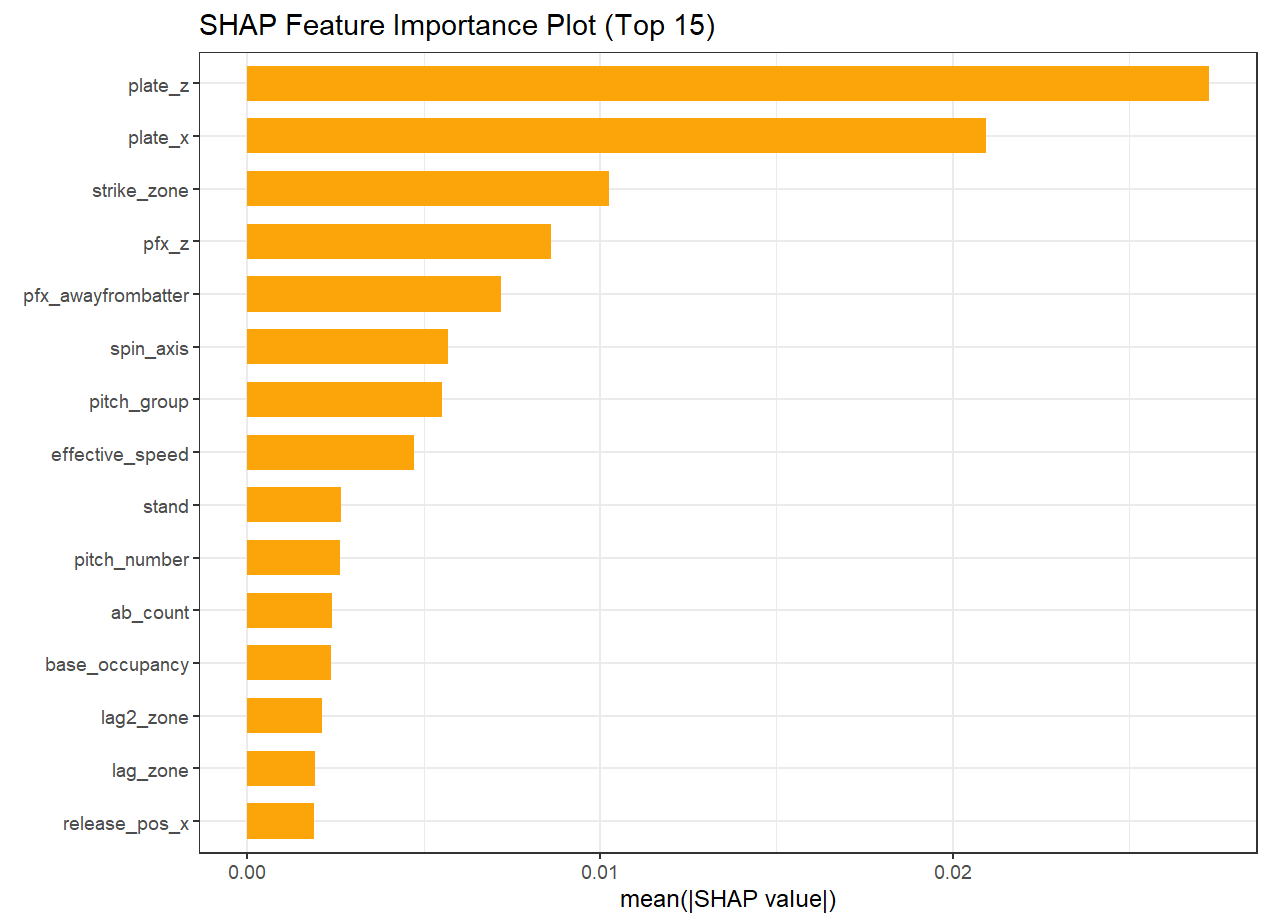
A feature importance plot (Figure 1) should give an idea of which are the most important predictors our model is using. As one would expect, the ultimate location of the ball is crucial to getting a called strike. It’s hard to get a called strike if it’s not in the strike zone, or at least in the neighborhood depending on how lenient an umpire is. But even within the strike zone, there are locations where called strikes are more likely to occur, with height upon arrival to the plate being a little more useful for prediction than its horizontal position.
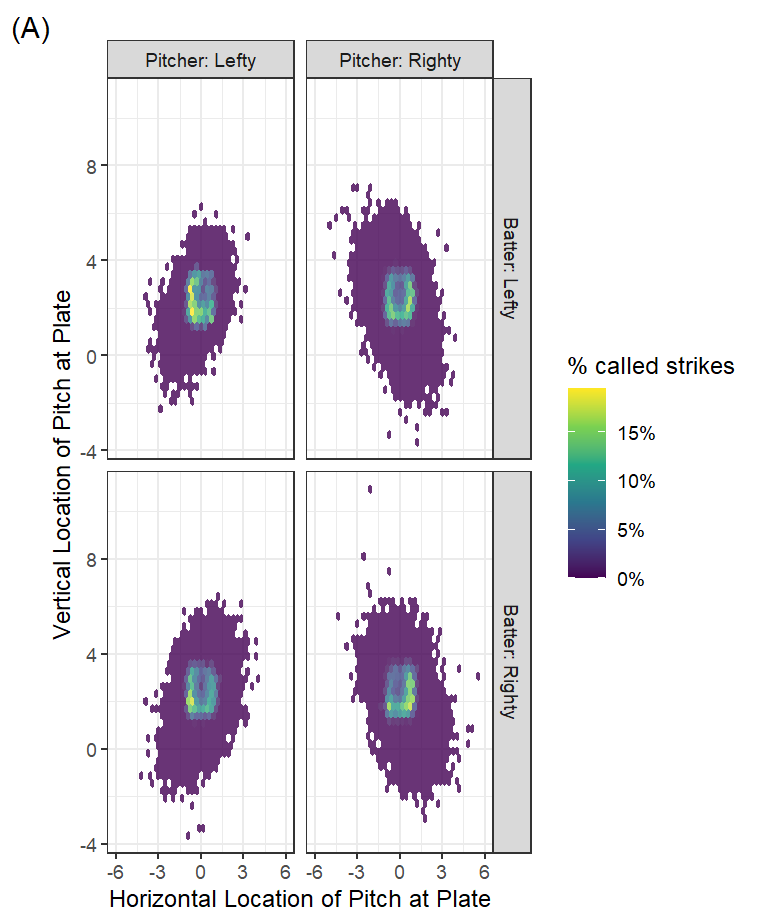
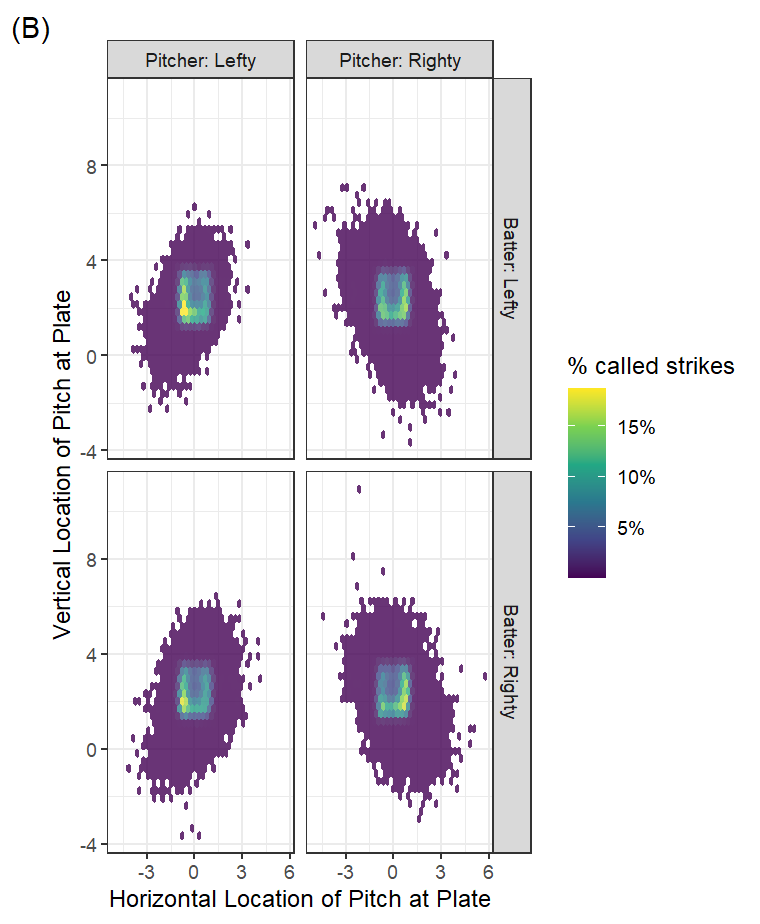
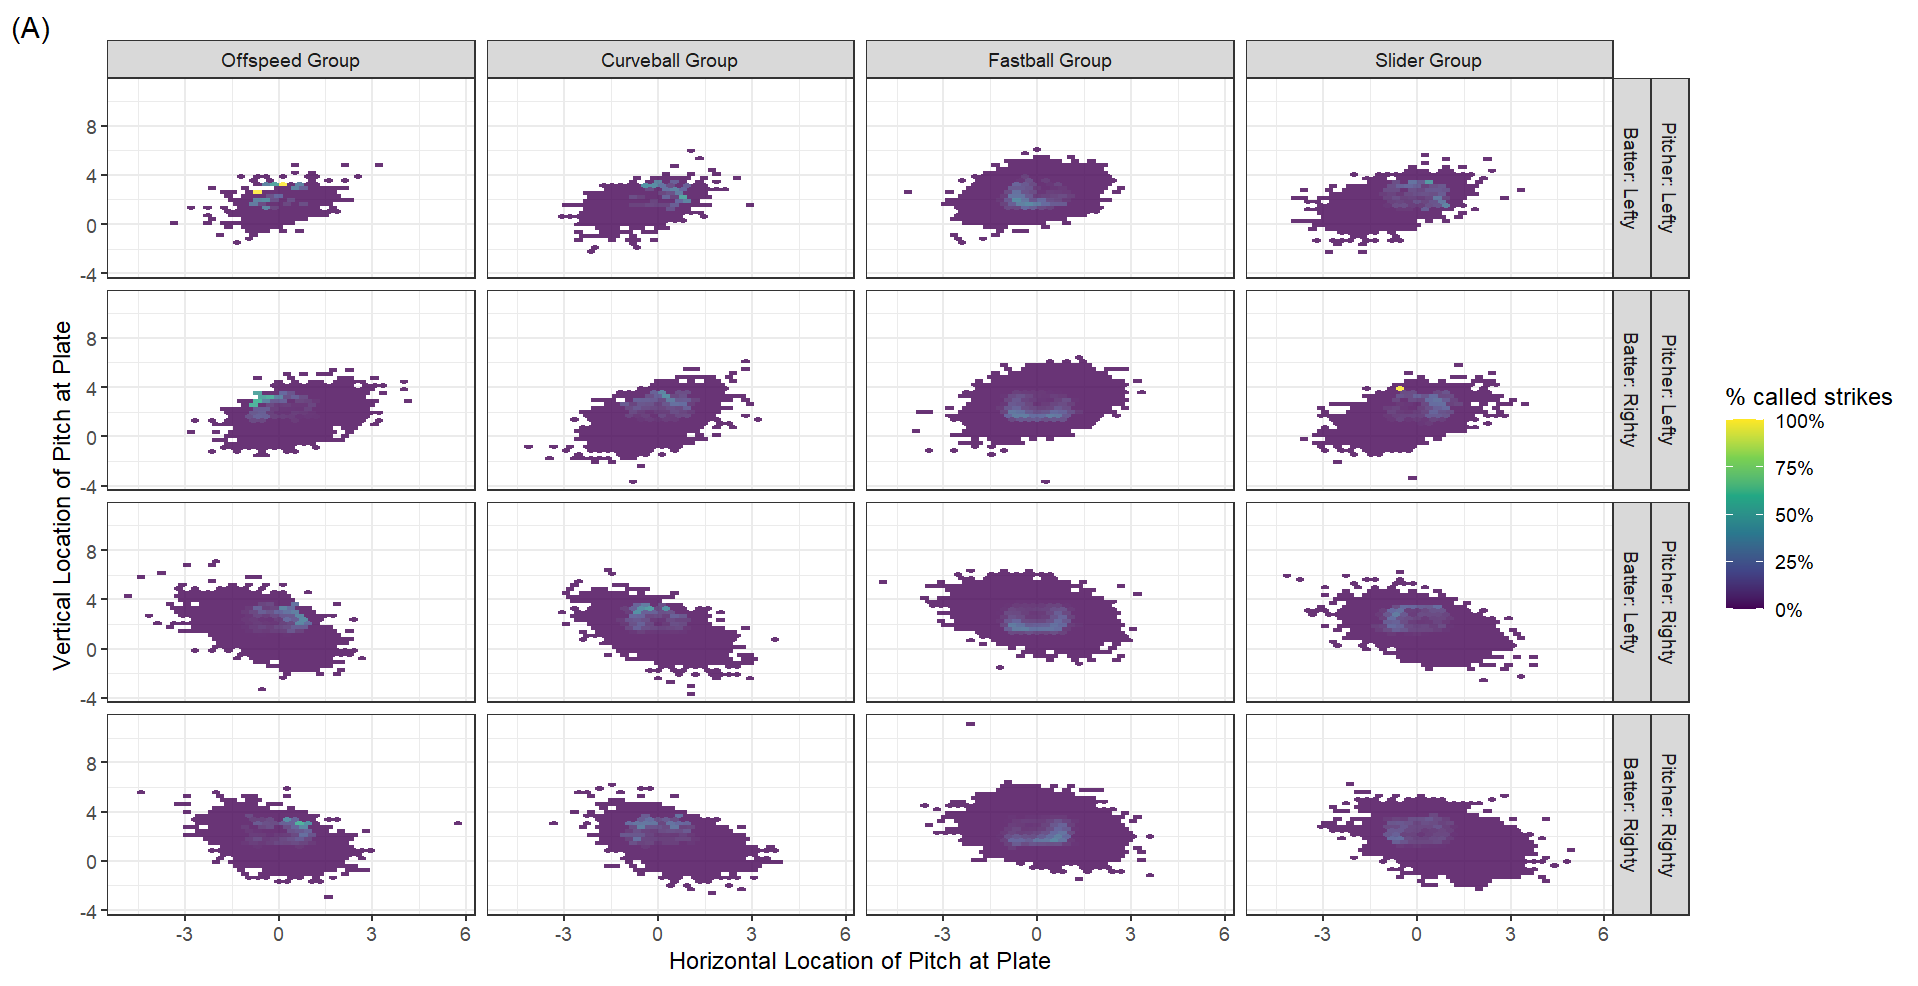
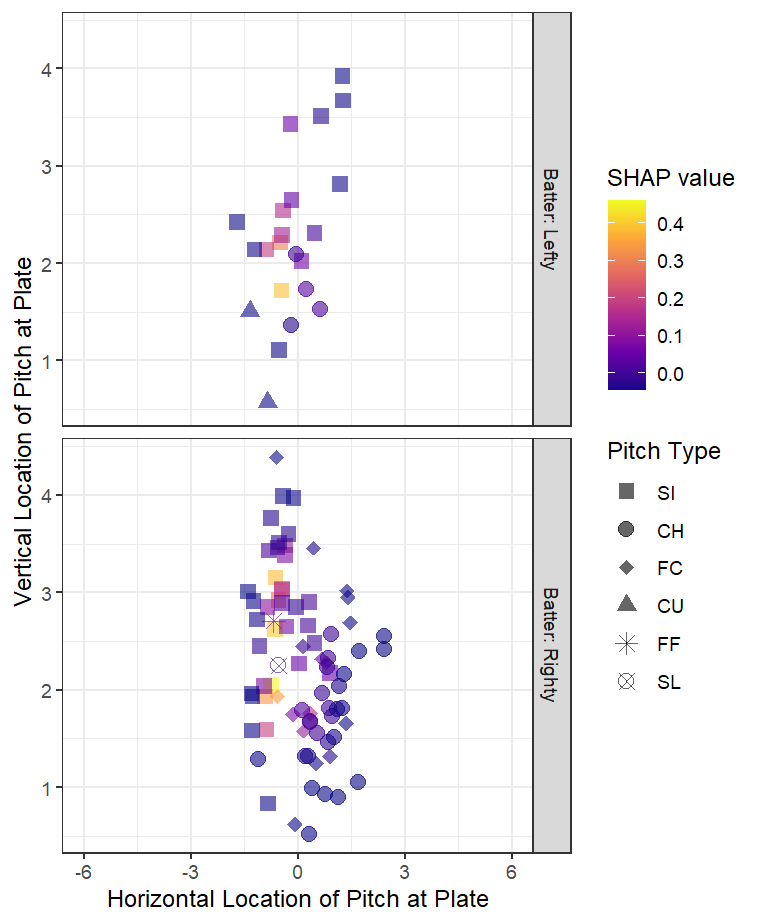
Given its primacy in importance, a quick plot of pitch location and success should be informative. Pitcher and batter handedness are typically regarded as important factors since they essentially flip the relationship between batter and ball, so I’ll divide our dataset into these characteristics. Using the test data to visualize (Figure 2), the patterns exhibited by the actual data (A) do seem to be captured in the model (B). Pitches traveling through the heart of the strike zone, as well as those over the middle of the plate but higher in the zone, seem most consistently poorer targets for getting a called third strike. Those are probably locations from which batters are more likely to swing and possibly make contact.
Pitch break on the vertical and horizontal axes are high up on our variable importance plot, and are often dictated by the pitcher selecting a pitch type. Through that, they controls the speed of the ball and spins which induce different movement paths on the way to the plate. So seeing the same location through the lens of pitch choice may be a convenient way to see how location, break, and speed interact to produce our outcome of interest.
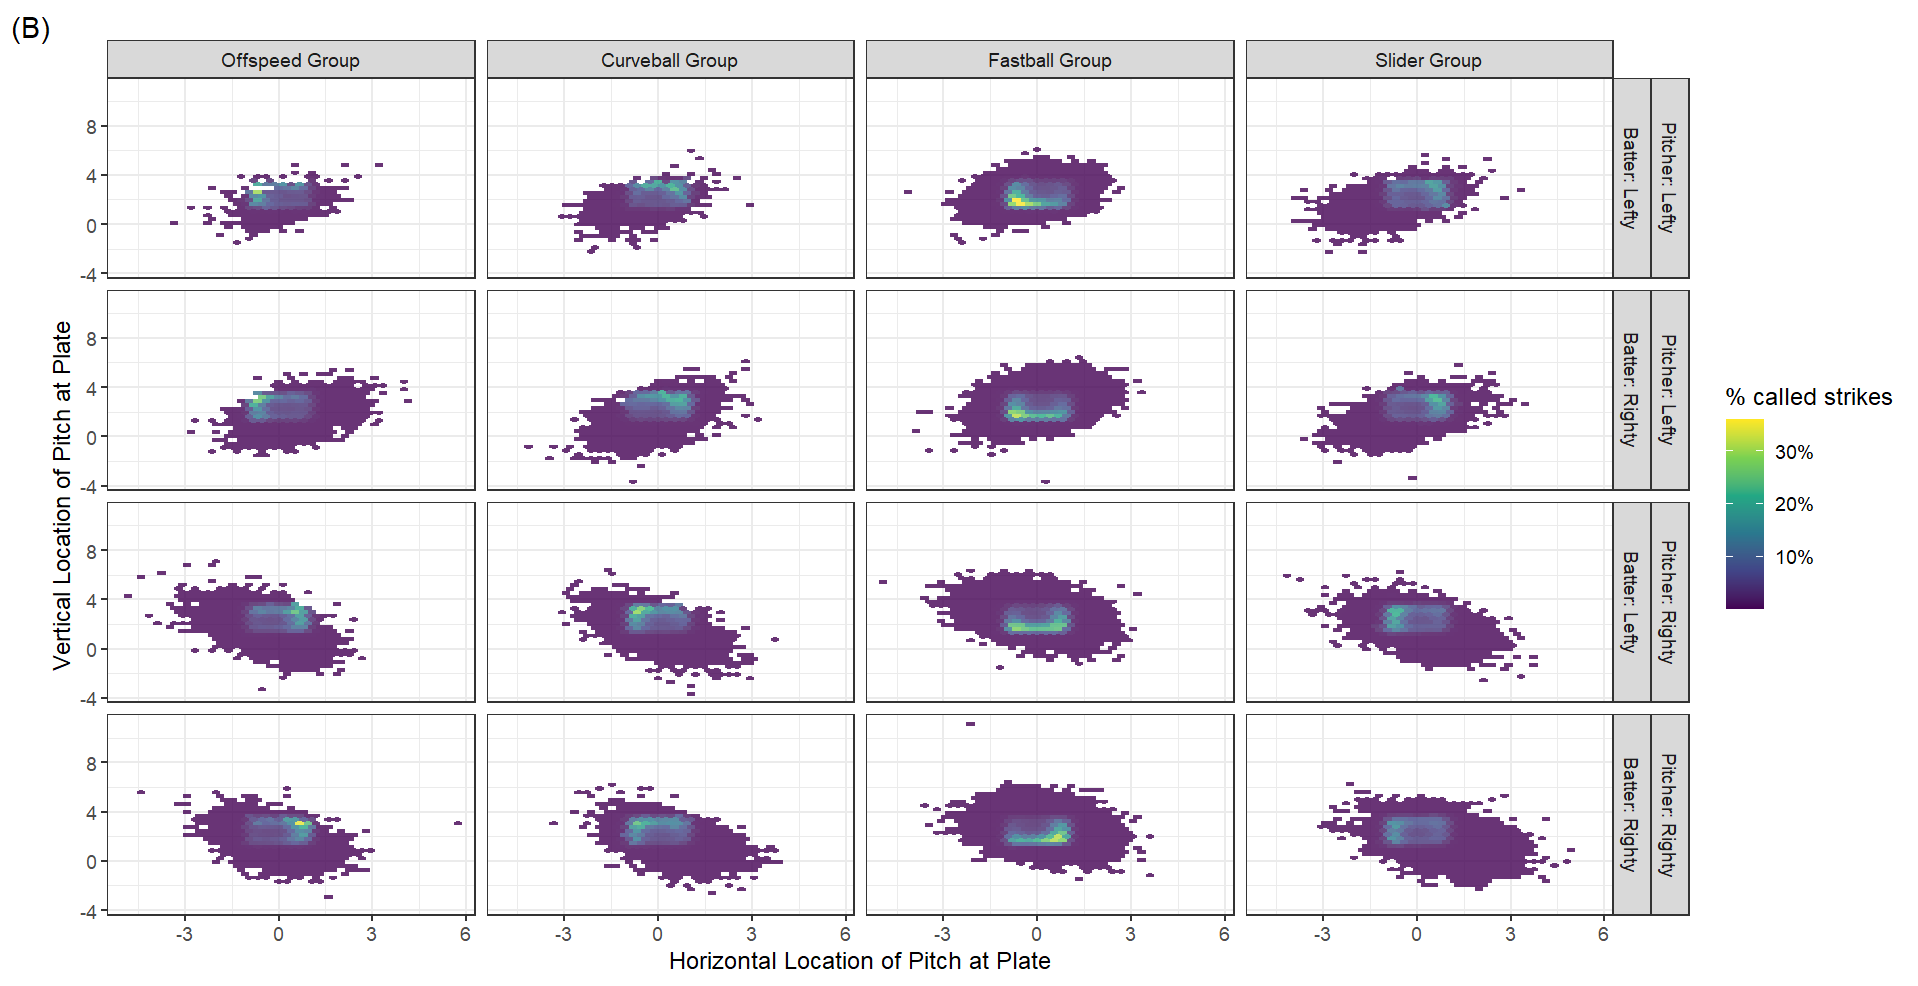
When looking at the called strike map by broader pitch group (Figure 3), for the test dataset (A) and its modeled predictions (B), our model can resolve the fact that different pitch groups have different regions that produce the most success. For example, low in the strike zone is best, for fastballs, specifically low and away when the batter and pitcher share the same handedness, and low and inside when they are opposites.
For breaking pitches (curveballs and sliders), the opposite holds true, with the most taken strikes coming from high and inside for righty-righty and lefty-lefty matchups, and high and away for non-matching matchups. As for offspeed pitches, lefties seem to do better throwing high and to the left side of the plate regardless of where the batter is, while righties succeed throwing higher and to the right side of the plate.
But are larger groupings enough, or are there even differences within those groupings? Without giving the model the explicit pitch type, can it differentiate them? We do provide the model information on spin axis and rate, as well as speed, which should help with differentiation. But there is also a fair bit of overlap in these characteristics given the different pitchers that throw them, so it might be a difficult assignment.
Visuals split by the more specific pitch type show model outputs can see differences between four-seam fastballs and sinkers. Sinkers are predicted to be similarly successful on the right side of the plate regardless of height, while most of the success from four-seam fastballs comes the low and away pitches that we mentioned for the entire grouping previously. The model may hint at differences in offspeed pitches, with changeups best high and away, while high split-fingered fastballs are successful regardless of where they are over the plate.
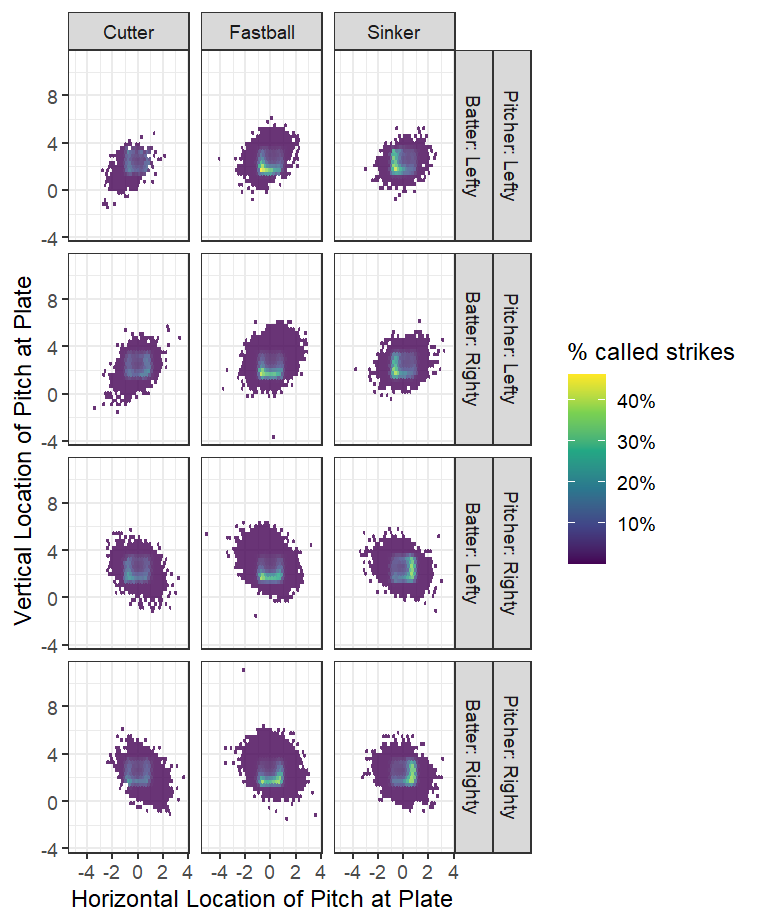
Given that I didn’t provide the specific pitches, it’s decent indication that our model is able to account for different pitch types using spin rate and axis variables it was given. This certainly promotes confidence of using lightgbm in other contexts where multiple pathways can lead to the outcome of concern.
The overarching pattern our model asserts is that pitches that yield called third strikes the most are the ones that appear to arrive outside the zone but utilize the natural breaking motion of the pitch to sneak it back into the edge of the strike zone.
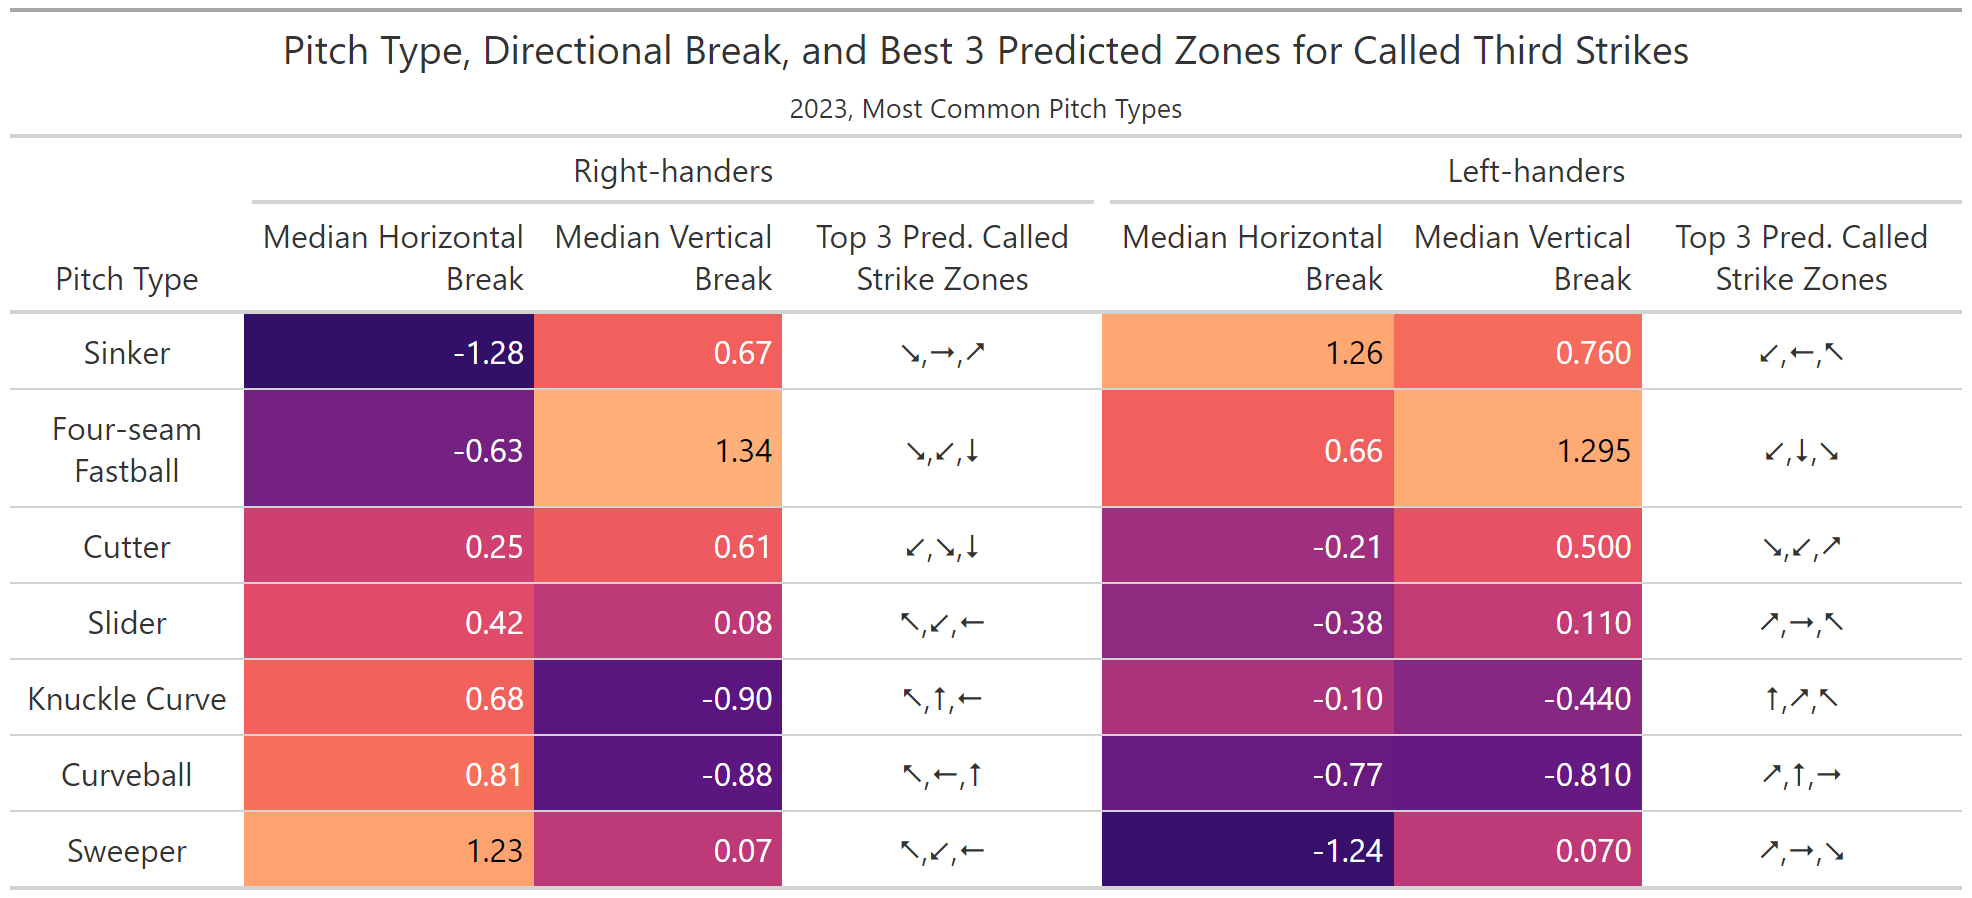
For example, right-handers throwing sinkers rely on their horizontal break to sneak them into the outside part of the zone for right-handed batters and the inside of the zone for left-handed batters, with those with greater breaks showing a bit more success. Changeups have similar horizontal breaks, and show similar bands of success in these situation. Sweepers have the highest median break in the opposite direction horizontally, so highest success areas are on the other side of the plate.
Curveballs and knuckle curves have the most median vertical drop among the more common pitches, and placement of those pitches high in the strike zones predicts higher success, with additional effectiveness at the left of the plate due to their additional moderate horizontal break to the right. Four-seam fastballs have the most upward vertical break, and their effective strike zone region is along the lower edge of the strike zone.
Ultimately, this makes logical sense. Given the split-second nature of the decision, a strong way to get a batter not to swing is to throw a pitch that looks unlikely to terminate inside the strike zone. This seems to line up with previous analyses noting the effectiveness of glove-side sinkers and high zone breaking balls in garnering called strikes. They do mention that two-strike counts may be much less efficient than other options because of the high swing propensity and contact probability, so it would make sense to expand the model to addresses wanted and unwanted outcomes more holistically if trying to extract strategic insight.
Player-Level Predictions
As you would expect, this model could identify which pitchers succeed in getting called third strikes. Looking at pitchers in our holdout testing dataset, for those with at least 50 attempts, Ian Gibaut is the highest on the list, netting 13.7% called strikes for his throws in that situation. The model seems to be a fan of his placement of four-seam fastballs placed on the lower outside of the plate to right-handers and coupled with the vertical break he can induce in those pitches.
Using SHAP values to examine predictor contributions to the model predictions, Gibaut’s horizontal pitch locations influenced the model estimate the most, adding 1.6pp over baseline predictions, with his vertical break on these pitches contributing almost 1.6pp as well. His fastballs also tend to be located at a height more conducive to called third strikes, while this is on average is not the case for most fastballs.
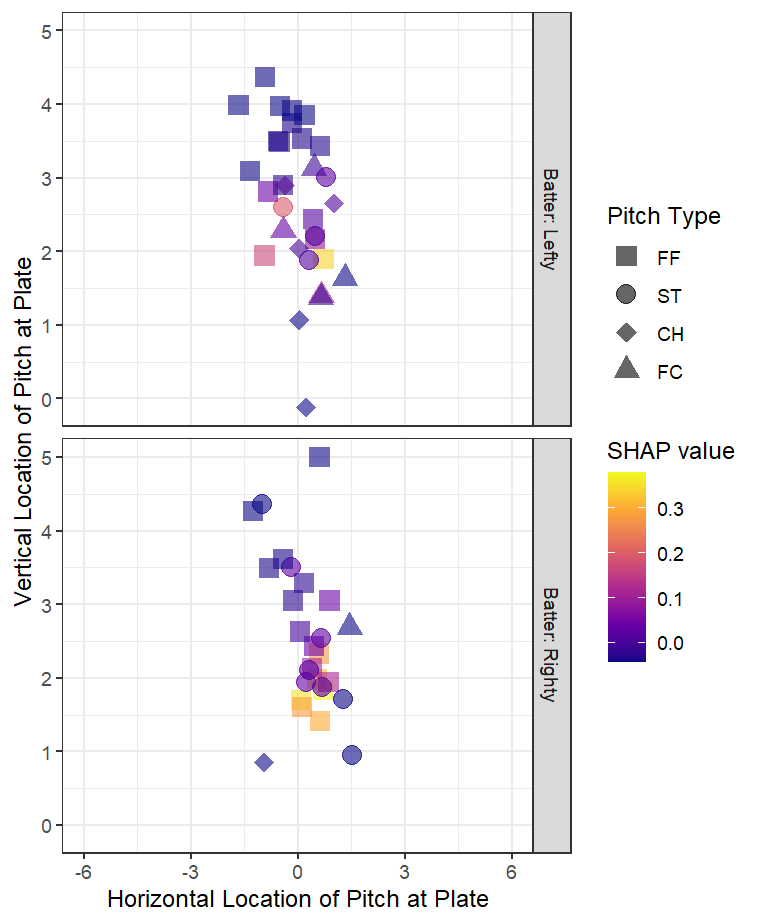
50 might be a bit small of a sample to be trustworthy, so let’s increase our minimum to 100. With that criteria, Martin Perez posts the highest average predictions across his test dataset pitches (8.8% called third strike). It seems like the model is picking up some stronger success with their sinkers on the left side of the plate (from the catcher perspective).
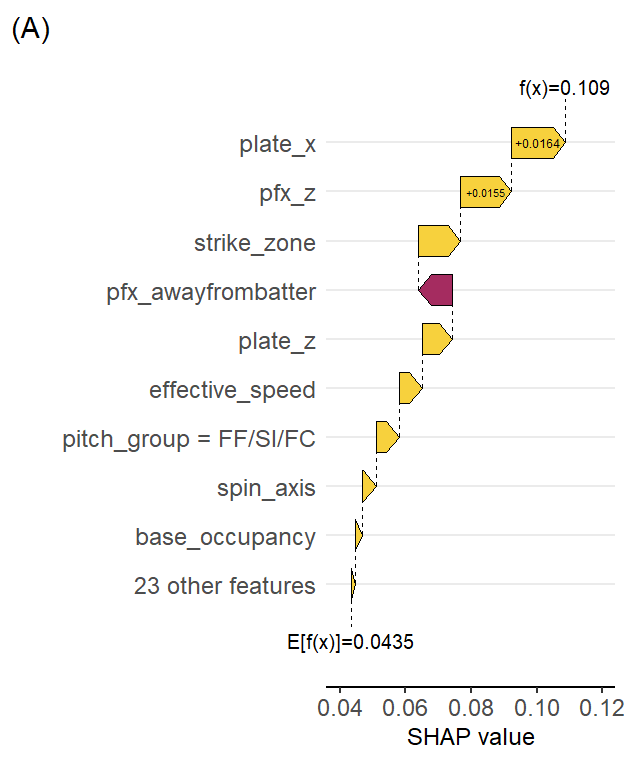
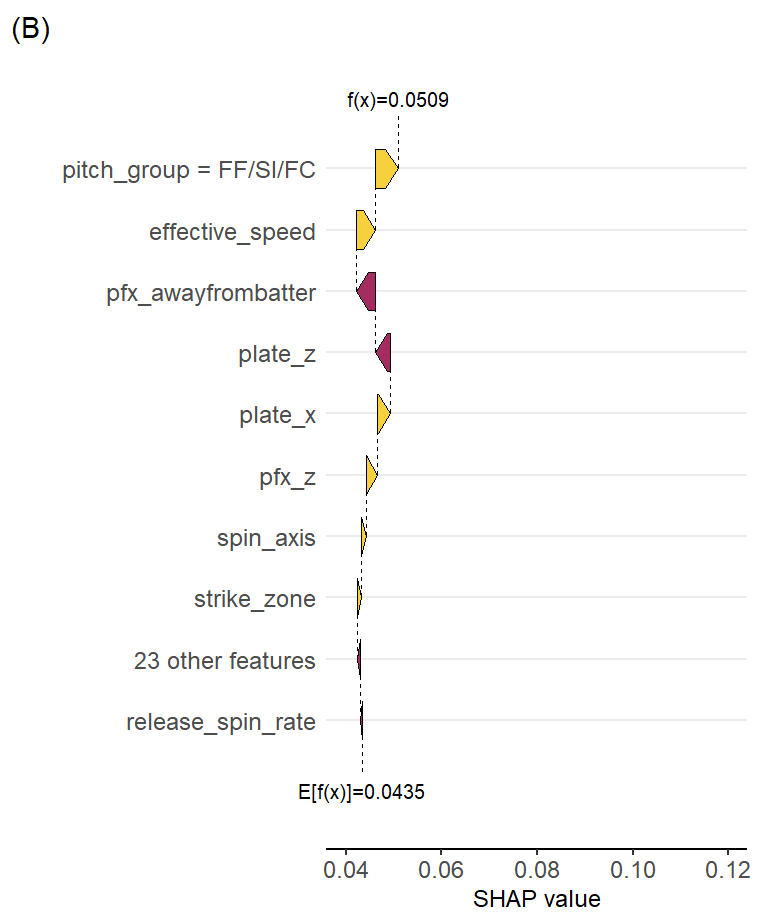
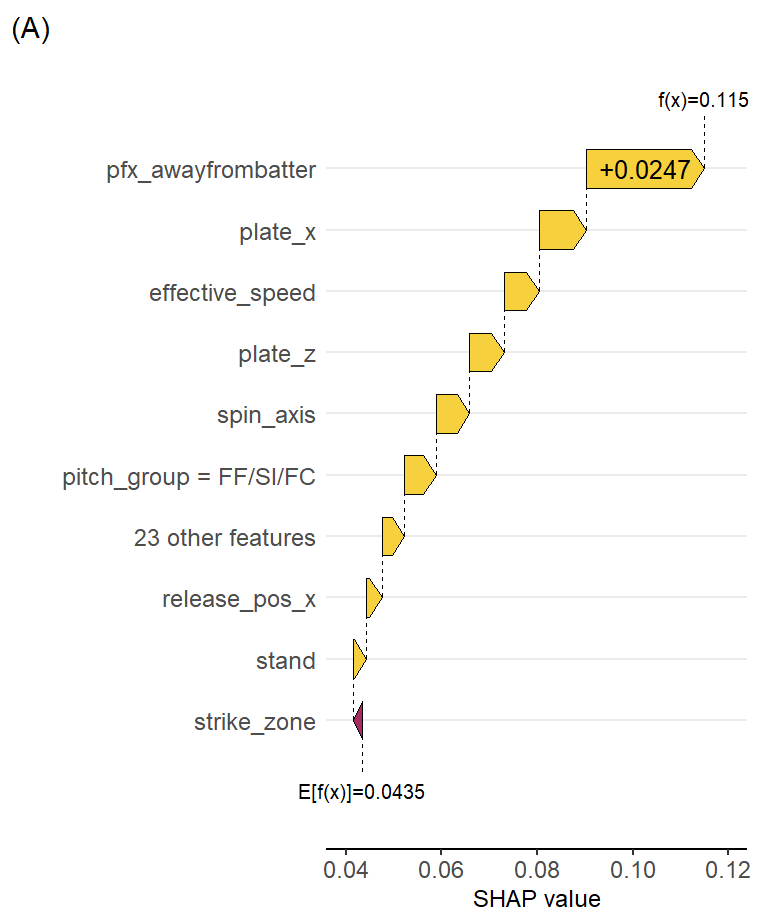
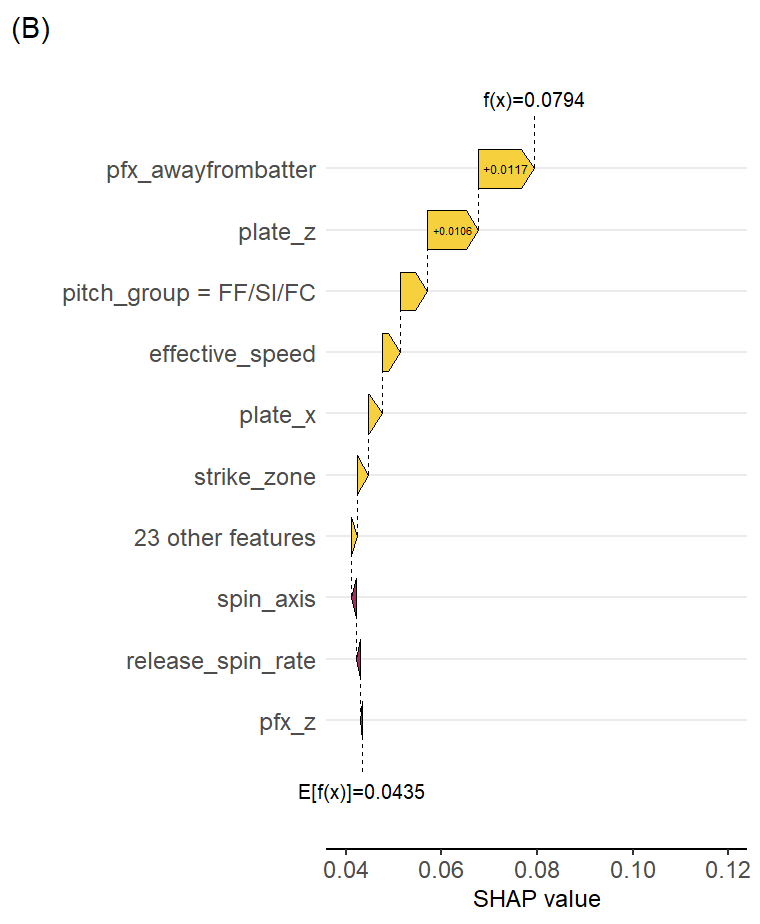
Looking specifically at Perez’ sinkers (A), horizontal break on their pitches is contributing the most to their positive predictions (~2.5pp increase in probability), with speed and plate location variables following close behind (1.0 and 0.7pp increase, respectively). Overall, this leads to an expected called third strike probability of more than 11%. This contrasts with the typical sinkers from lefties (B), which don’t have as beneficial of a horizontal break, though those are generally predicted to be more successful than baseline at about an 8% probability of a called third strike.
I will mention that these two types of pitches, four-seam fastballs and sinkers, appeared quite frequently (51% and 32%) when examining the top 5% highest predictions of pitches being called third strike. So, pitcher-level values can be driven in part by pitch choice, but as we’ve seen location, break, and speed are strong contributors to how those estimates of predicted success are totaled.
Closing Remarks
While called third strikes seem like an obscure outcome to be investigating, an analysis like this has potential to inform pitching strategy. Being able to secure called strikes is likely preferable to swinging strikes, because the worst outcome is likely a walk. With any swing of the bat, a home run is on the table as a possibility. Moreover, certain circumstances reward not allowing contact with the ball, such as when base runners can be advanced on a fly ball.
There are some variables we don’t have immediate access to which might benefit our model. It might be easier for hitters to discern pitches in day or night games, for example. Hitters also have strengths and weaknesses that pitchers might try to avoid or exploit, consequently. Even catchers may alter called strike rates with their mastery of pitch framing. So while we do try to incorporate a fair number of factors into our model, other influences might be worth investigating further.
While the patterns identified in the model may be widely recognized within baseball organizations themselves, it’s a good demonstration our machine learning algorithm can parse out these relationships effectively. Still, this analysis was constructed as a predictive model and not a causal inference model, so immediately assigning the magnitudes of these statistical relationships as the degree of cause and effect coming from each could yield the wrong conclusions. This model can act as a framework for a causal model, however. Constructing a directed acyclic graph to select appropriate predictors for our model will help to design a one that accounts for confounding while better estimating total and direct effects from specific inputs of interest.