As I begin this project, 15-2 Lions have just fallen out of the NFL playoffs, done in by an upstart Washington Commanders squad in the 2nd week of the playoffs. While there were a number of unfortunate moments that contributed to the loss, one play that seems to have drawn disapproval online is a trick play that ended with an interception of a pass thrown by wide receiver Jameson Williams with the Lions down 10 and threatening.
INTERCEPTIONLions run a trick play with Jameson Williams throwing down field and Mikey Sainristil picks it off! His second INT of the game!Washington in complete control!WOW!#RaiseHail
[image or embed]— Chad Ryan (@chadwiko.bsky.social) January 18, 2025 at 7:45 PM
On the surface, a convoluted trick play at that point may have been an unwarranted risk, but it’s certainly one that Lions haven’t been shy about. That same quarter saw RB Montgomery take a pitch and promptly shovel it forward to WR St. Brown go for a 20 yard gain and eliciting a “What?? I’ve never seen that in my life!” from color commentator and known football-experiencer Tom Brady. And in the previous quarter, Williams scored a 61-yard TD on a double handoff end around play to punish an overeager Washington defensive pursuit. Overall, the Lions still netted 1.9 estimated points added (EPA) on those 3 plays. My question is, how productive and how risky are these less conventional plays reliant on skill players deploying skills they don’t normally apply?
Fortunately, there should be enough information captured in the readily available play-by-play data to take a look at a number of questions around these types of plays (or at least, an identifiable subset of them). The ones I’ll focus on for this exploration:
How successful are these plays compared to typical offensive playcalls?
In what circumstances are they most utilized?
Which play designs are more productive?
Does success differ noticeably by position group?
Which specific playcallers gets better or worse outcomes?
Which players achieve the most success?
Data
For this look, I’ll focus on plays similar to the Jameson Williams pass and easily classified in recorded data: the non-QB pass. Admittedly, there are a large number of ways to execute this, but all should at least have the element of surprise, given their rarity. The downside, of course, is putting a non-passer in the position of having to assess coverage, dodge oncoming defenders, and execute a throw with their less practiced throwing arms accordingly.
As with our previous looks at NFL statistics, I’ll grab data provided via the stewards of the R nflverse repositories. For this project, I’ll need play-by-play data, as well as general player data to identify the typical position of the passing players. I’m also interested in how often specific playcallers utilize these gimmicks, and will fold in the NFL playcallers dataset provided by Sam Hoppen.
I’ll classify which passes were thrown by QBs and which were thrown by players not identified as QBs in the player database for the 2006-2024 seasons. Also, because they seem like very different scenarios, I’ll separate offensive plays from instances where the team was in punt or field goal formation, since those come from very different formations and circumstances. Lastly, I’ll omit plays identified as “aborted” to eliminate fumbles where the play has likely gone wrong and players might be ad-libbing out of desperation. The final dataset includes not only passes, but sacks and scrambles to get a fuller picture of all the outcomes and their production. I also included penalties, since it’s possible that these kinds of trick plays could result in more penalties on either the offense (e.g. illegal motion) or defense (e.g. pass interference).
To define success, I’ll focus on EPA and success rate, defined here as a positive EPA on a play. I’ll also report turnover, sack, and penalty rates rates to provide an idea of the riskiness of these plays.
Findings
Non-QB passing plays were rarer than I personally had expected, composing 0.2% of the 885 pass attempts (the Lions were at 0.9% for the 2024 season, if you were curious). 236 of those belonged to special teams plays, which I’ll give quick look separately at the end. The remaining 649 offensive plays won’t provide much power to authoritatively differentiate between different characteristics of the non-QB passes further on in the analysis, but could still be interesting enough take a look.
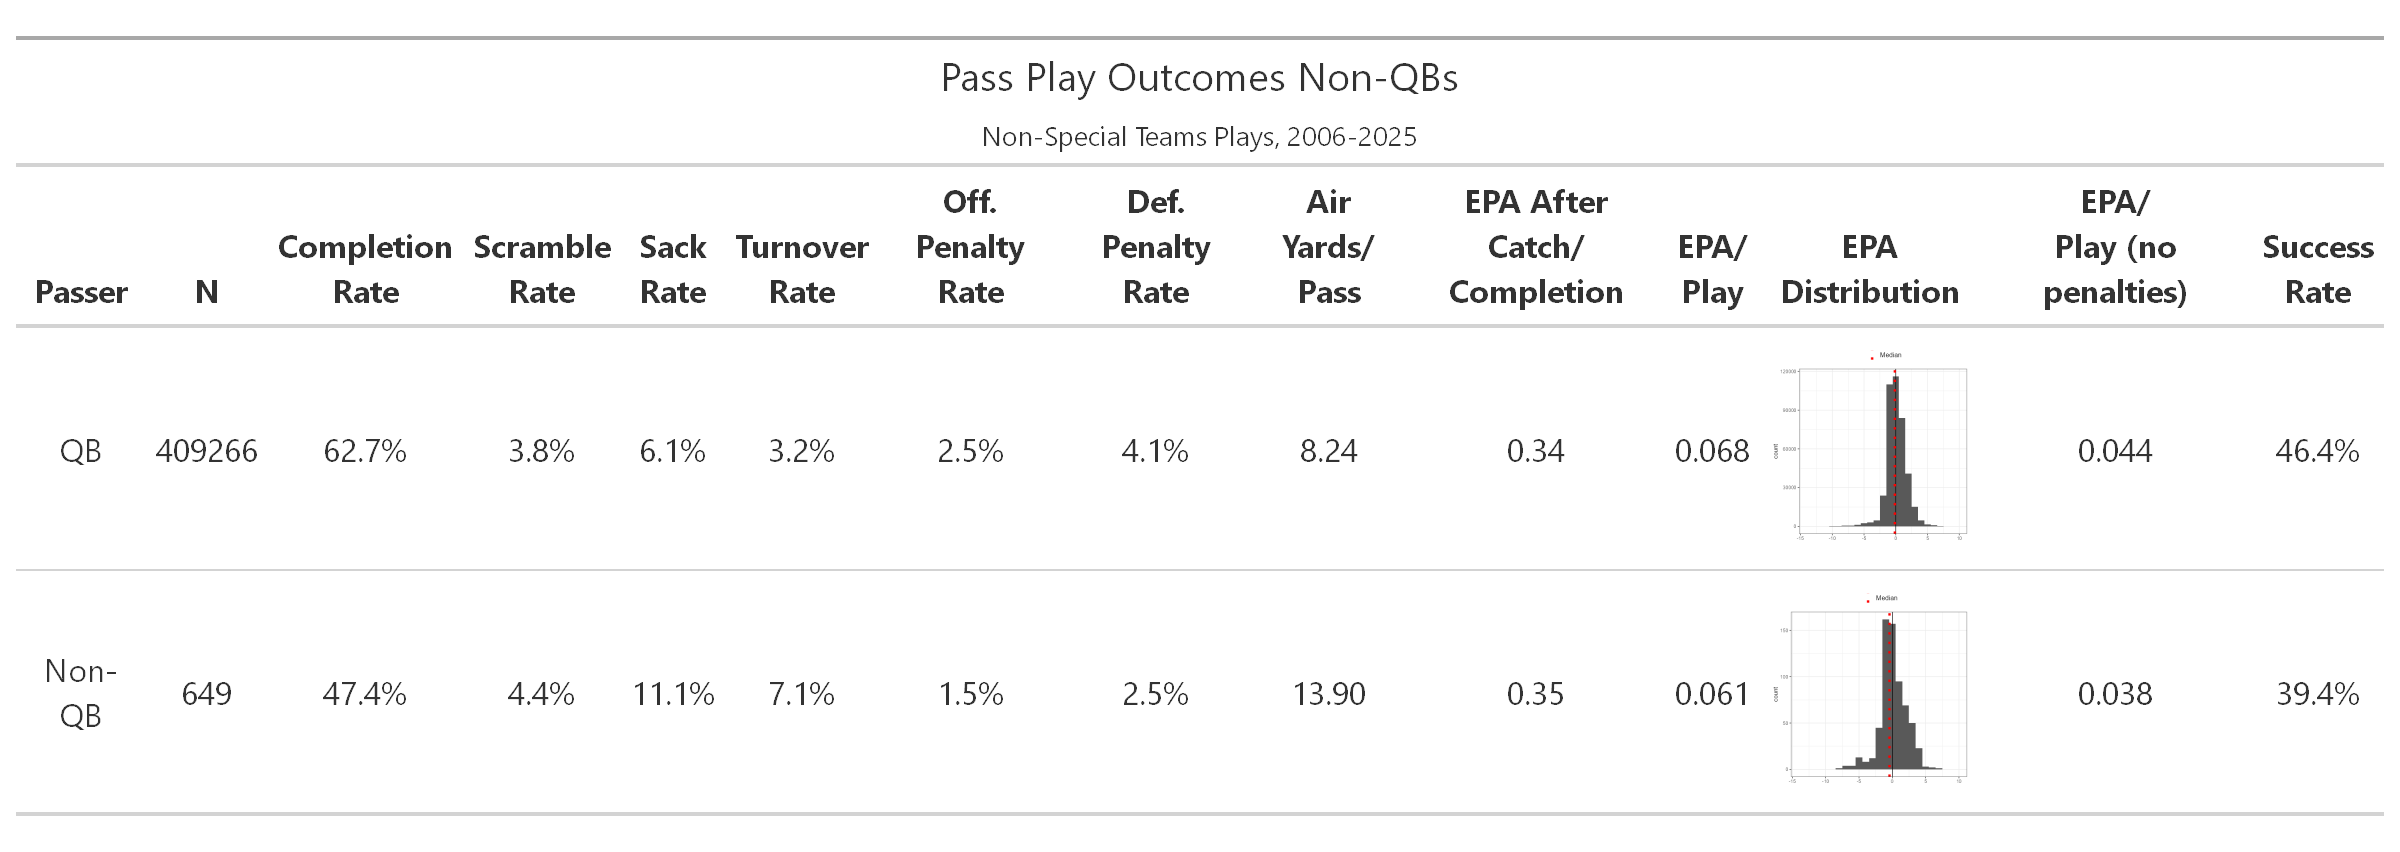
Table. Cumulative Statistics for Pass Outcomes by Passer Type
Pass comparisons between QBs and non-QBs were unkind to the non-QB plays. EPA was lower on average, whether including or excluding penalties, but virtually indistinguishable statistically (p=.92 and p=.94, respectively). However, their overall success rate was also 7 percentage points lower, a large difference (p<.001). Penalty-excluded success was similar. This seems to be the result of multiple factors, as they were completed at a lower rate, and yield markedly higher rates of sacks and turnovers. Penalties were also lower for non-QB passes for the offense, but also slightly more so for the defense, so that was a net negative as well.
The one positive was that completions took place further down the field, generating more yardage, while not differing from typical pass plays in production after the catch. The greater pass distance for non-QBs might be a consequence of play design, where short passes are less likely because that negates the point of drawing the defense towards the line of scrimmage. For whatever reason, these plays seem serve as higher risk-higher reward plays that might serve a purpose in playcalling mixes, but aren’t consistently more productive than typical pass plays.
Circumstances
The situation and timing of when these plays were called could certainly have influenced the efficiency of these options, so I’ll explore some factors below.
Distance to Goal
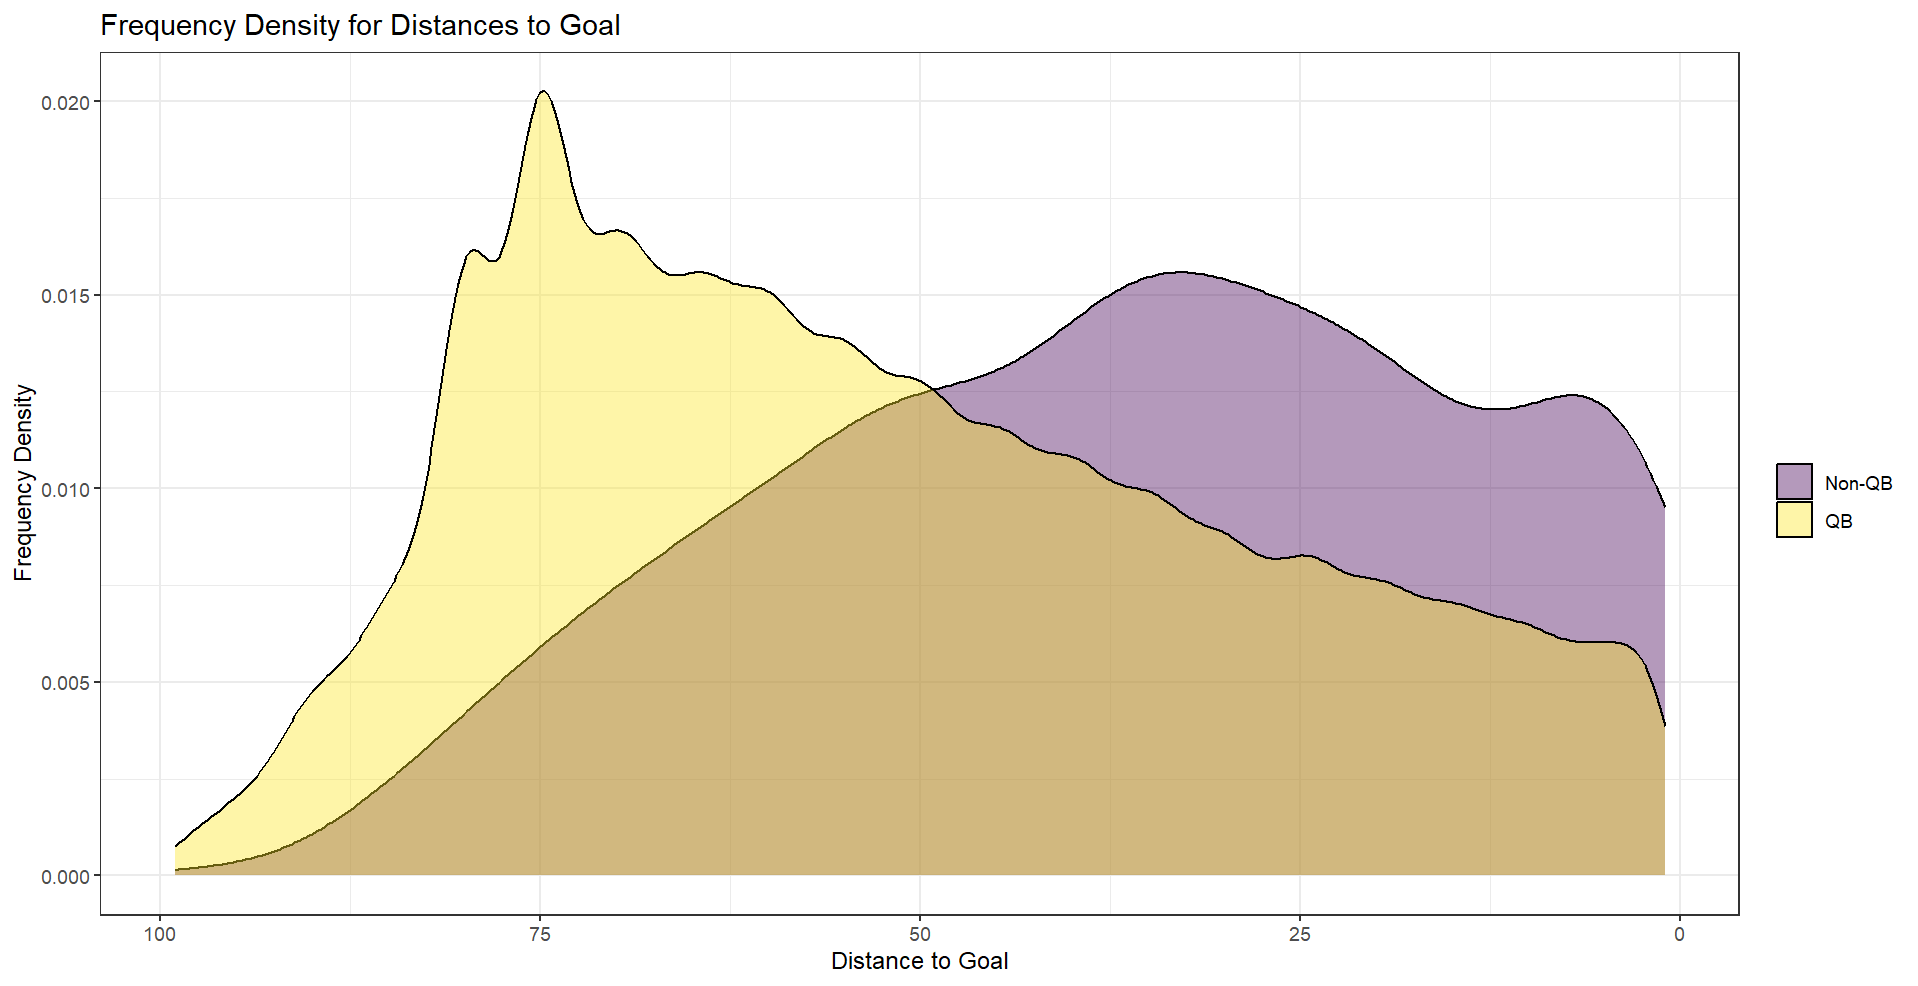
Figure. Frequency Density for Distance to Opposing End Zone at Play Snap
The factor where the usage of non-QB passes most differed from typical passing plays was for distance to the opposing goal line, with non-QB passes being more likely closer to goal. This could be a conscious effort by playcallers to minimize the risk of a possible turnover, a preference for deploying it closer to the red zone where passing becomes more difficult and the added wrinkle might feel more effective.
Lower distance to goal correlates with greater success.
- Contextual advantage: non-QB pass
Score Difference/Win Probability
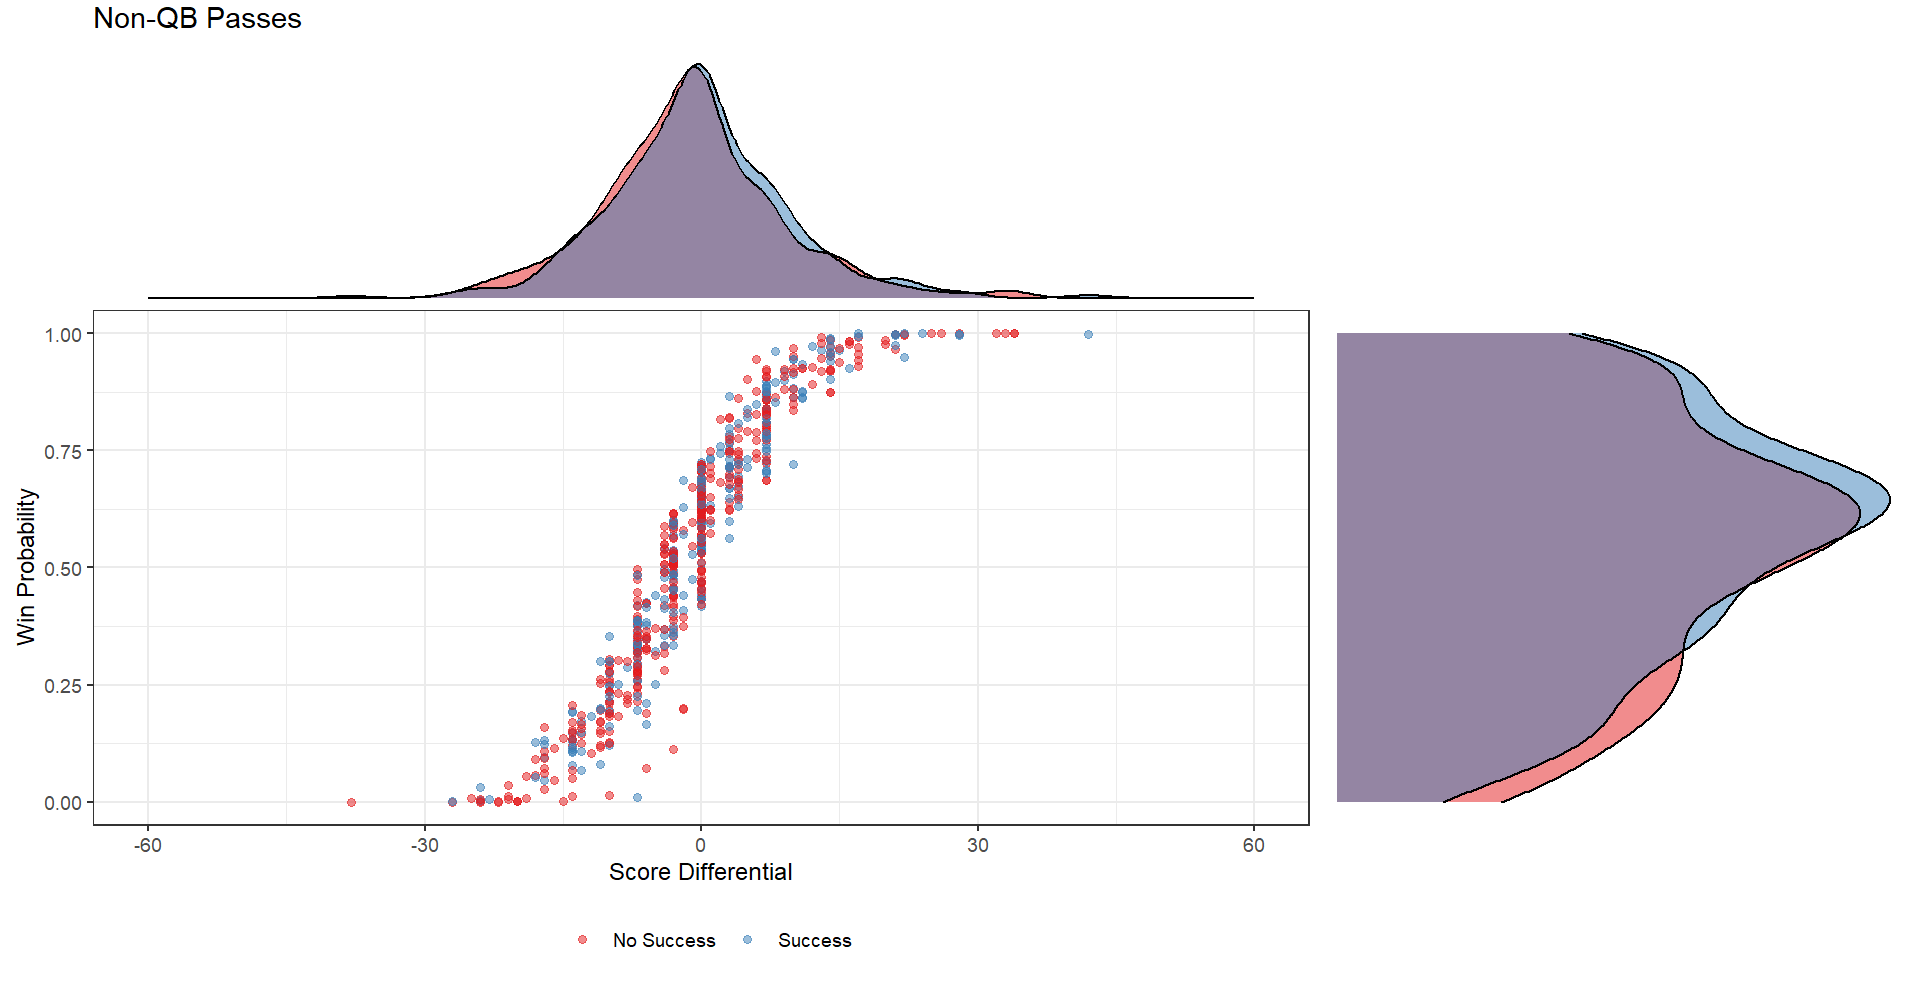
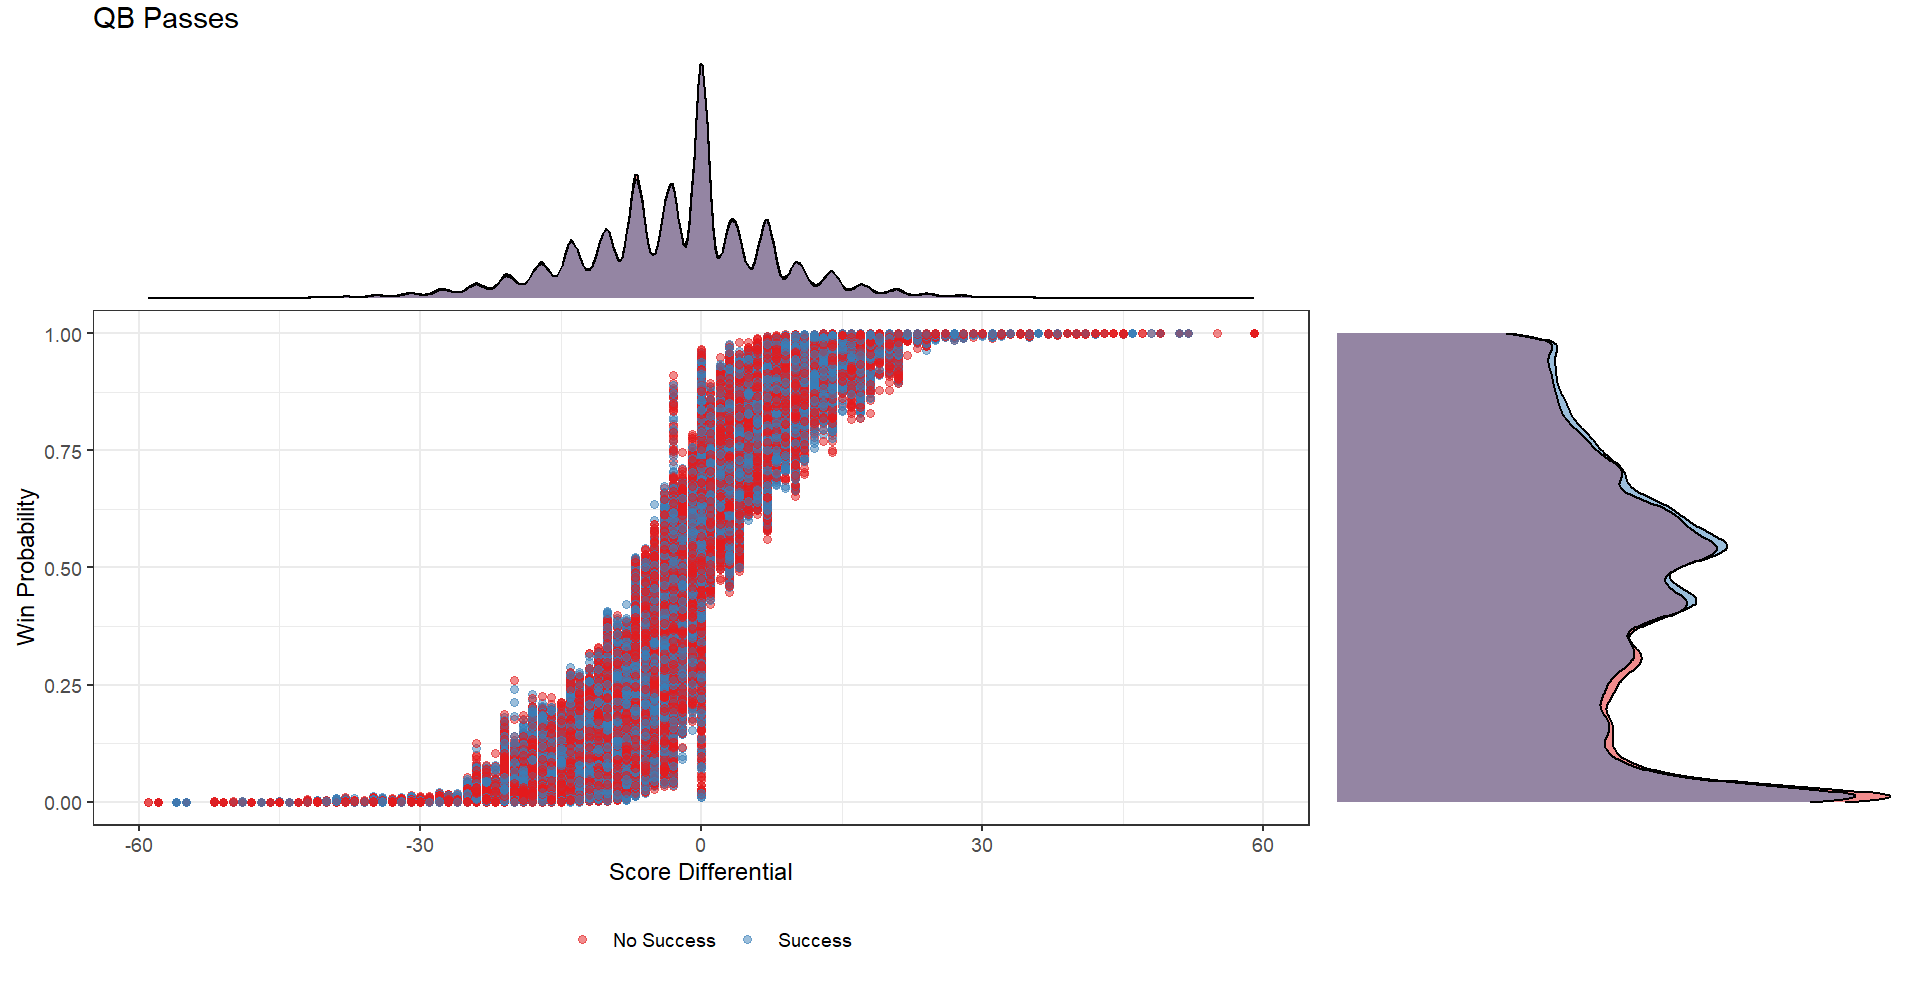
Figures. Score Difference and Estimated Win Probability for Non-QB and QB Passes
Win probability distributions (right marginal density plots) also differed for the two types of passes, with typical passing peaking towards 0% chance of winning, while non-QB pass frequency peaked around 64% win predicted. Interestingly, no obvious differences in distribution were seen for score differential.
Higher win probability typically correlated with greater EPA/per play.
- Contextual advantage: non-QB pass
Pass Probability
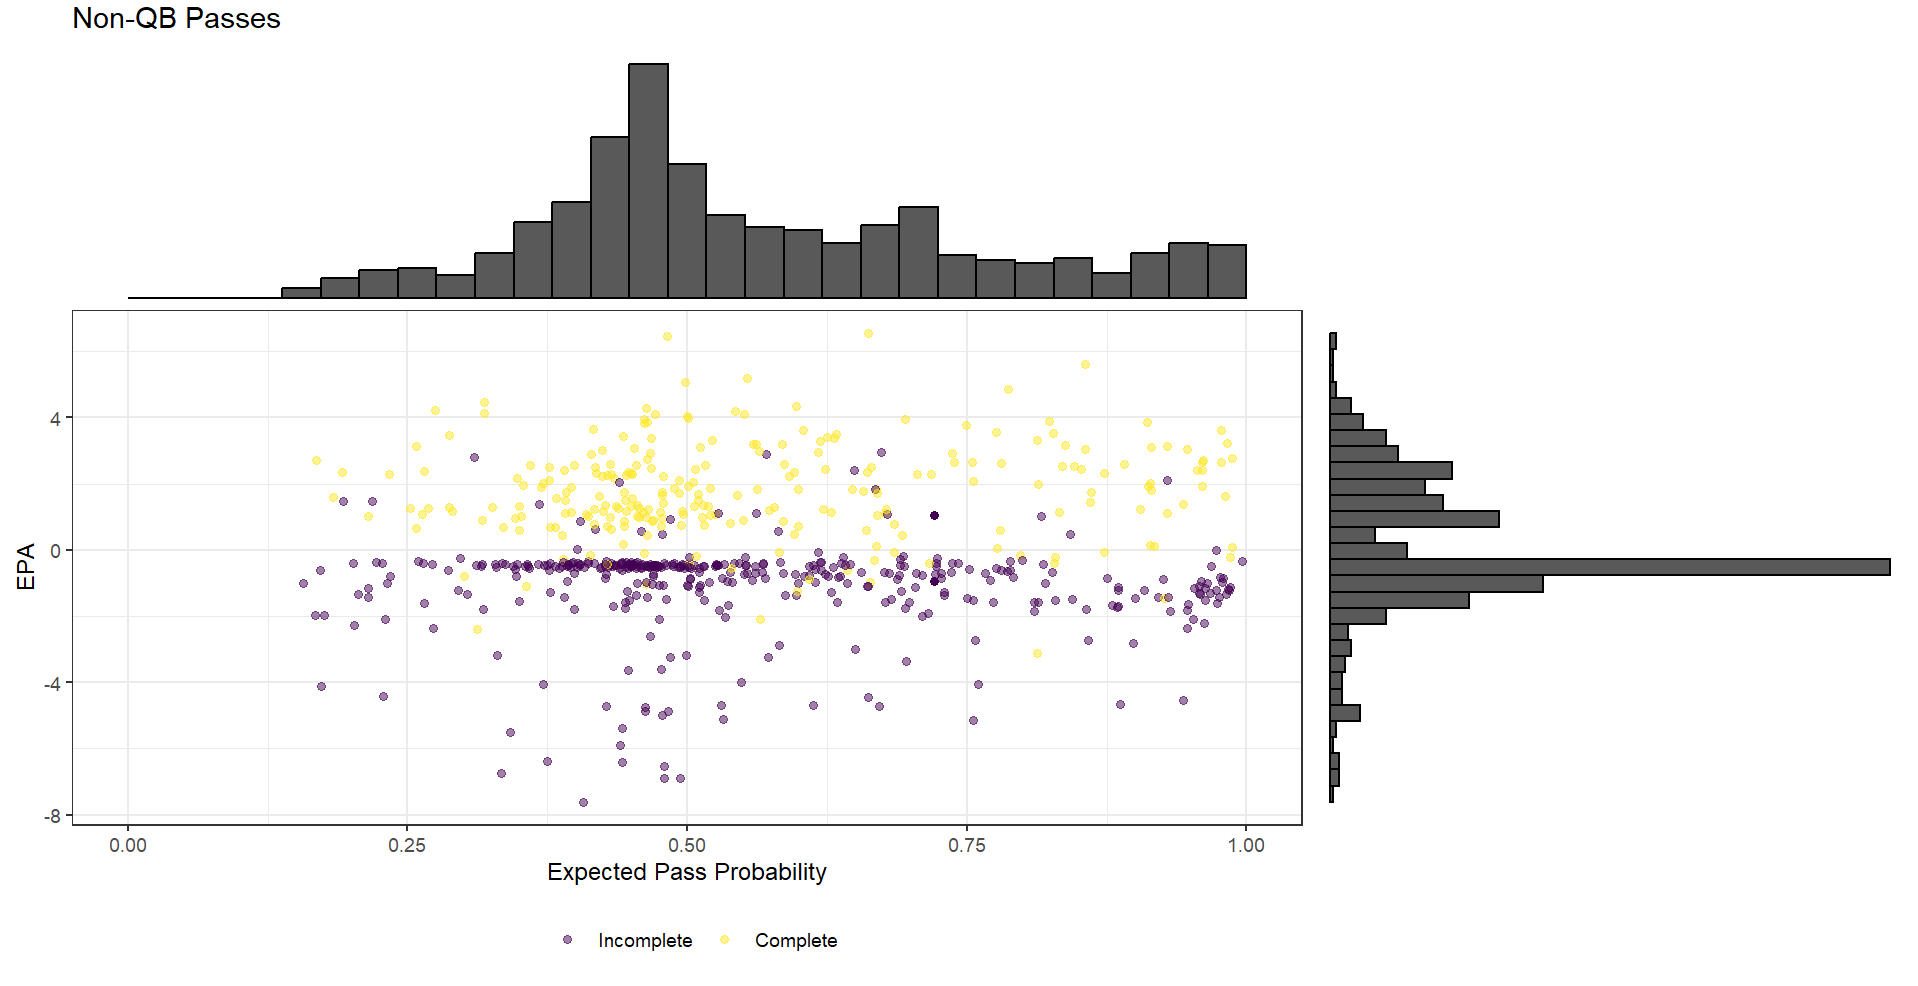
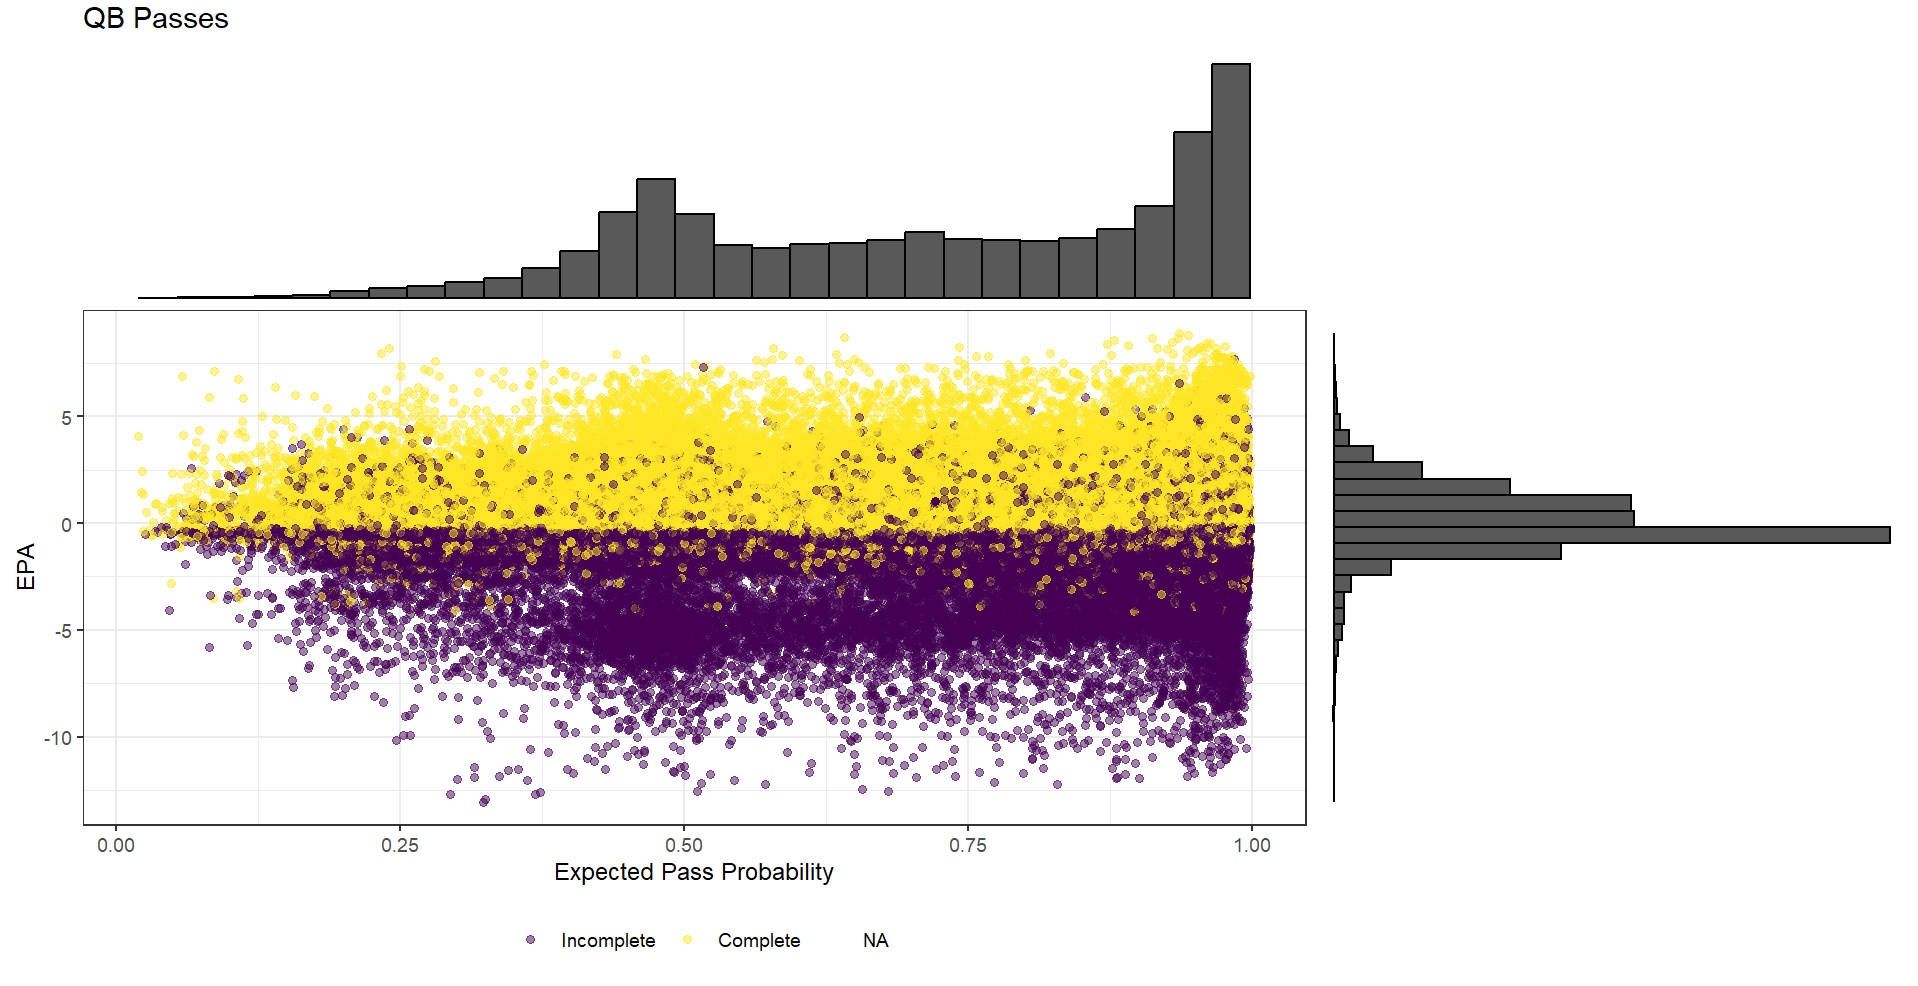
Figures. Estimated Pass Probability and EPA for Non-QB and QB Passes
Comparing the top marginal histograms, these trick passes were called more frequently in situations of lower pass probability, which is predicted by factors like score differential, win probability, time remaining, and down and distance, among others. This seems logical, as the non-QB pass is an analog to the vanilla play action pass where you feign a running play try a pass. In theory, they should work more effectively when the threat of run is strong and the defense is more prone to shifting away from receivers to pursue what they think is a runner.
Higher pass probability is linked to lower success.
- Contextual advantage: Non-QB Pass
Offensive Potency
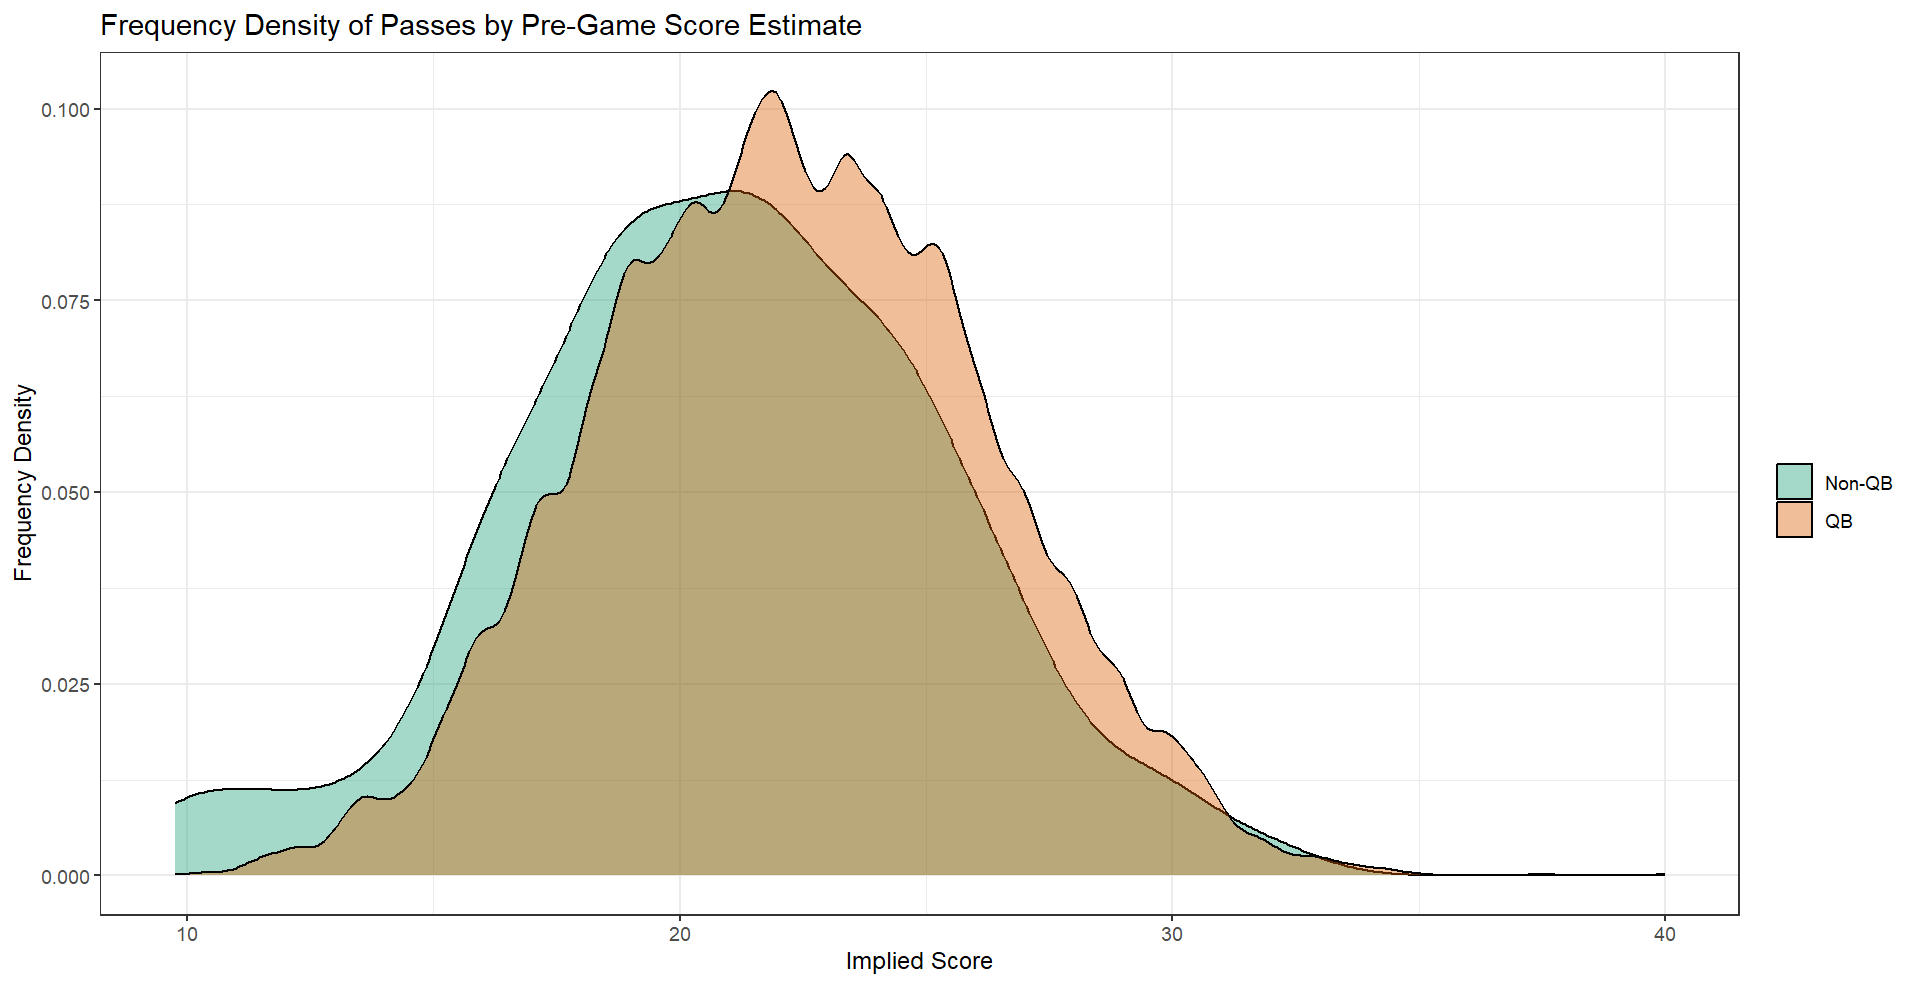
Figure. Frequency Density for Pre-Game Estimated Offensive End of Game Score by Play
Stepping back, they also seemed to be utilized by teams with lower pre-game predicted scores according to betting lines. This may be a sign that they are used by more offensively-challenged teams and/or ones against ones that are more defensively sound.
Higher offensive potency is linked with higher success.
- Contextual advantage: QB pass
Historical Time Trend
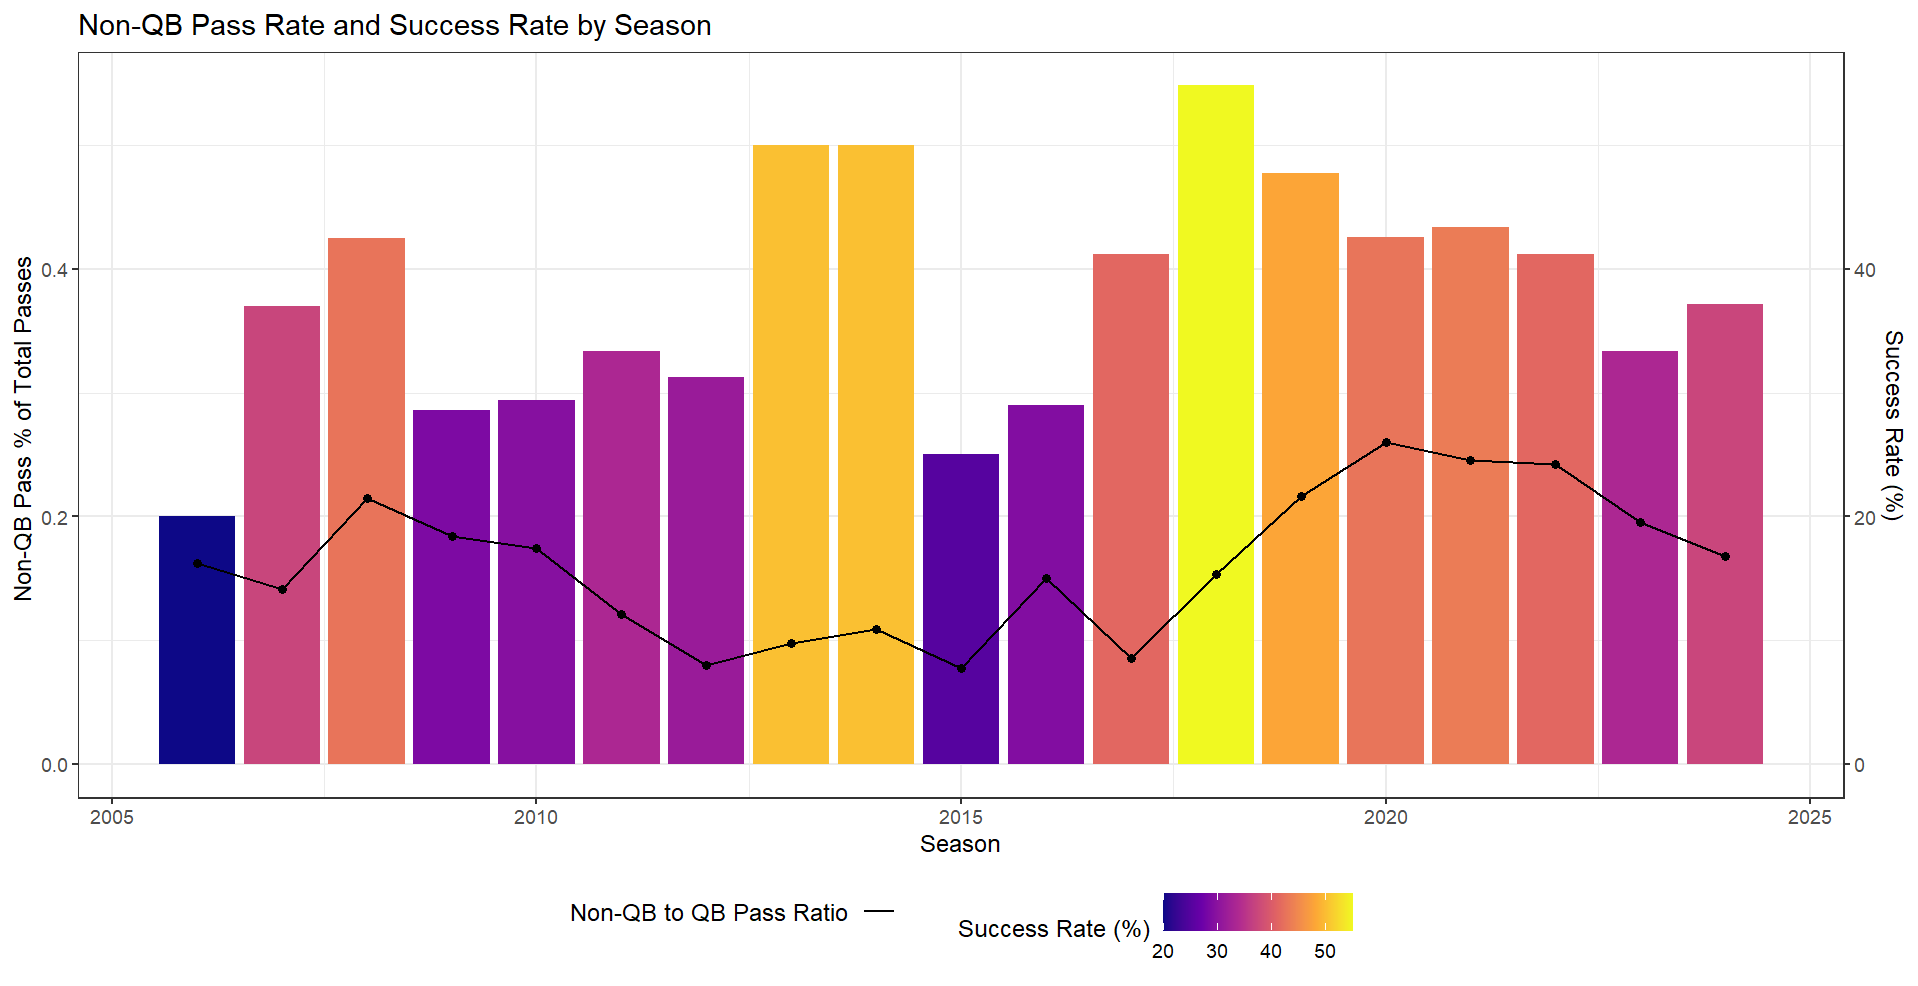
Figure. Non-QB Pass Usage and Success Rate by Season
Looking across seasons, there may be some cyclical pattern in the usage of these plays. Their success rates, however, only exhibited a slight long term trend, if any at all.
Contextual advantage: N/A
Subgroups
Just as circumstance can impact success, so too can characteristics of the plays themselves. And these plays can differ strongly, whether it be who throws the pass, who designs the play, or how that pass is ultimately orchestrated via X’s and O’s. If we classify these a number of ways, strong patterns might emerge that would help discern the most successful variant.
By Position
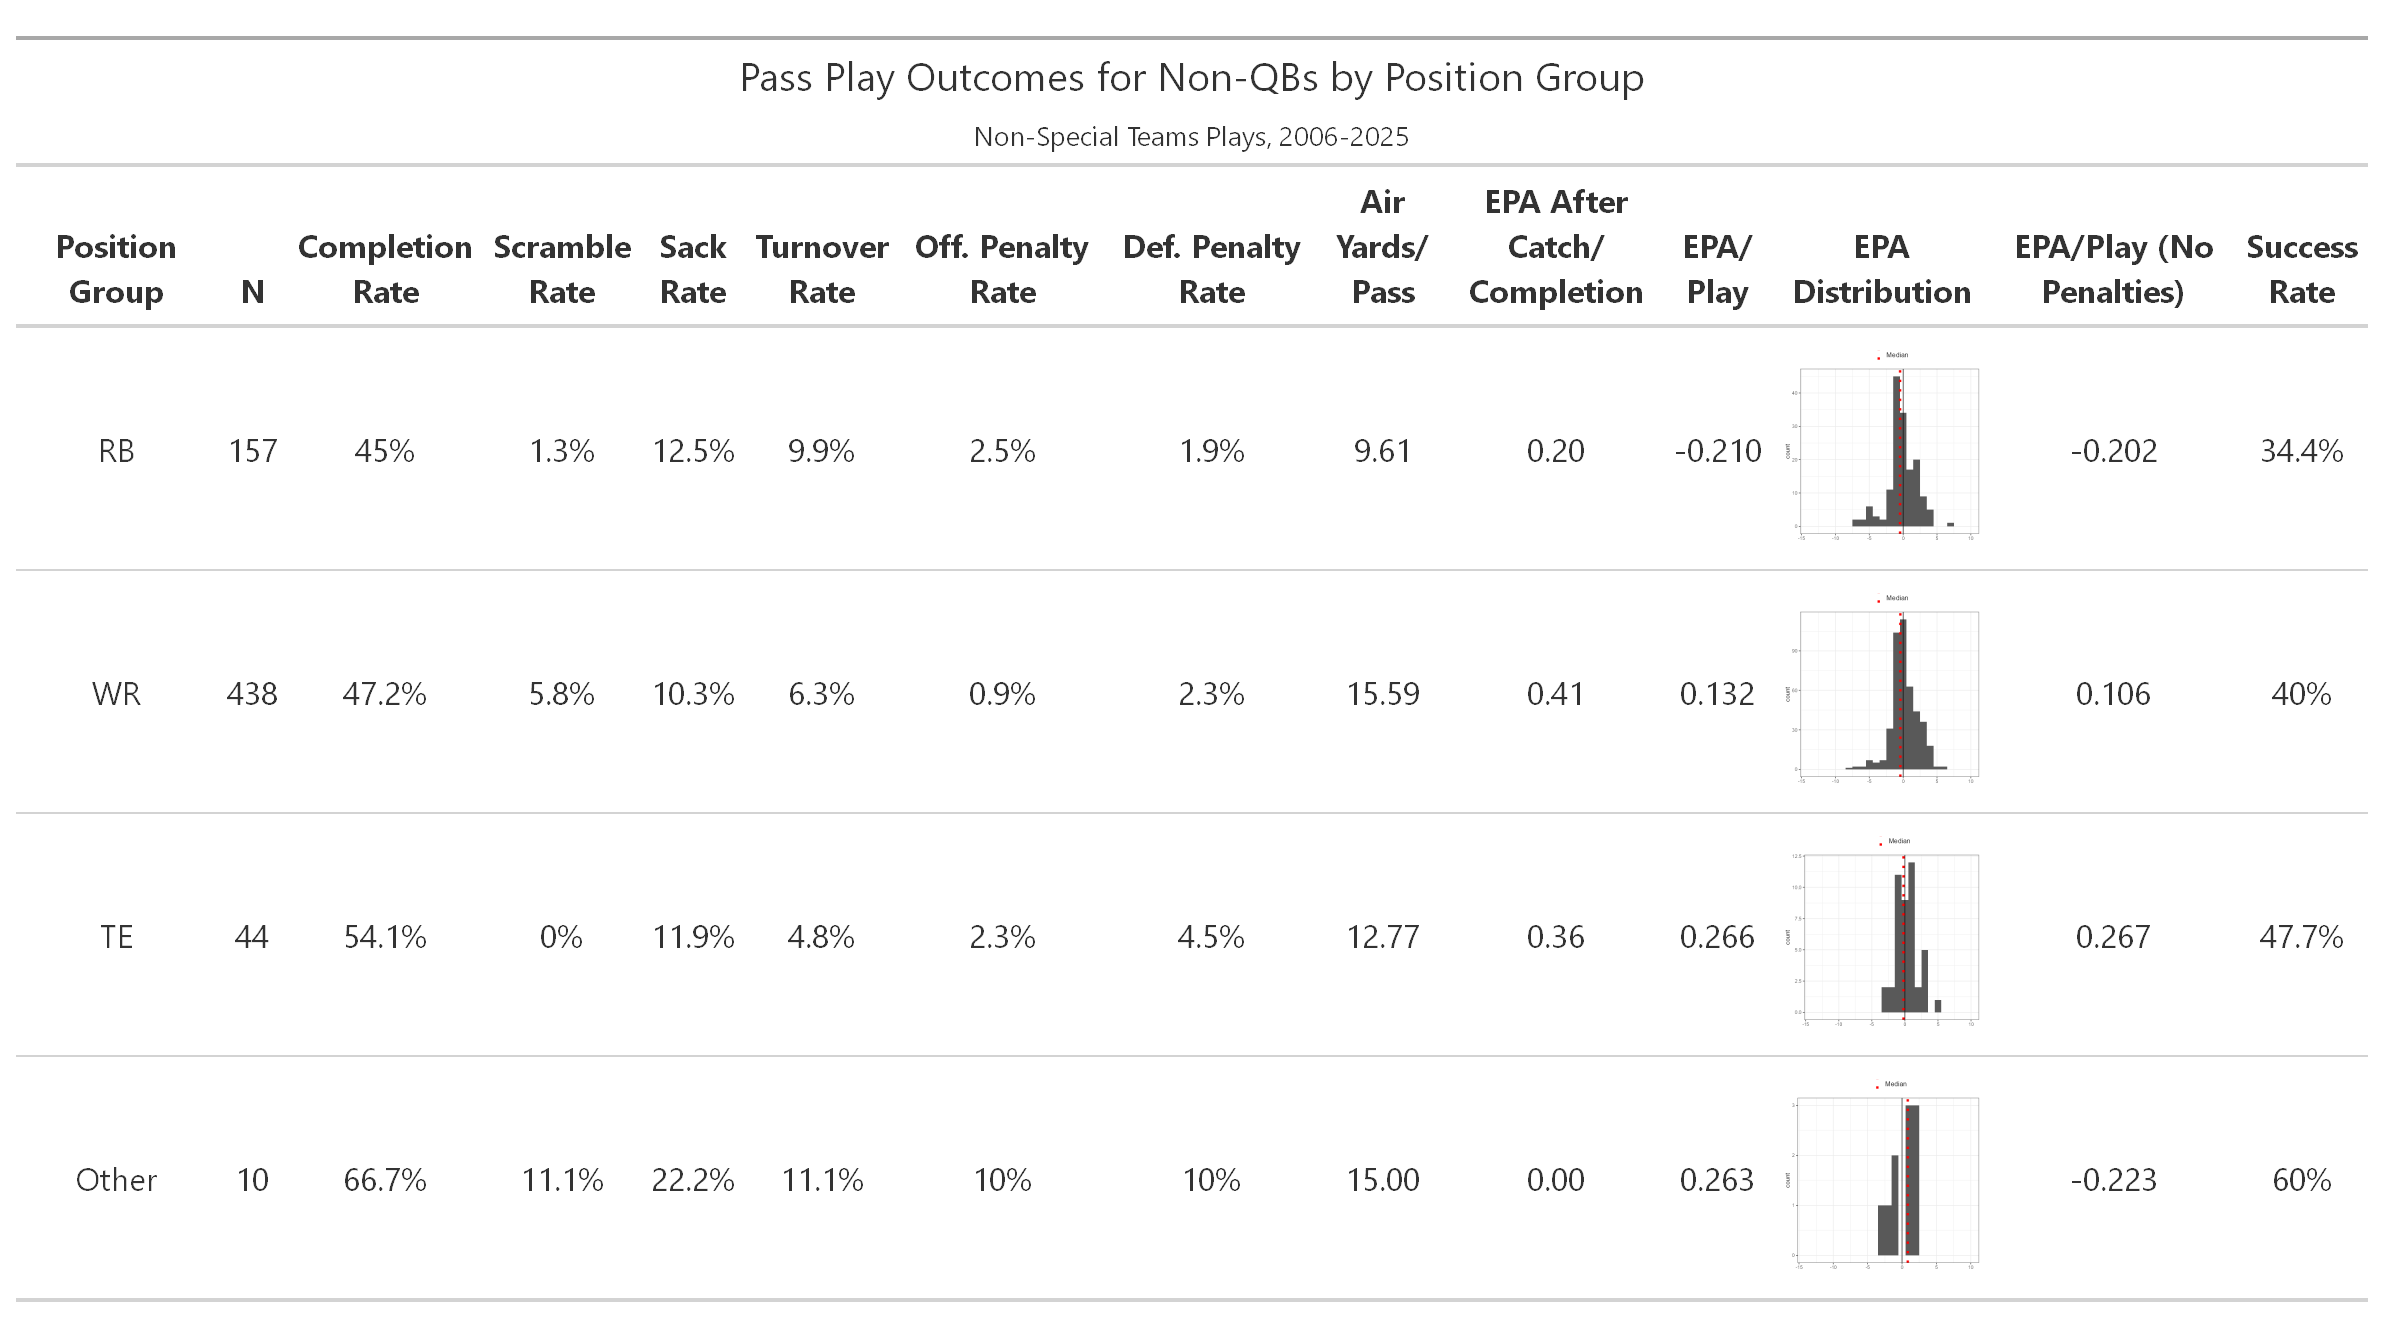
Figure. Table. Cumulative Statistics for Pass Outcomes by Position (Non-QBs)
WR attempts were typically more productive than for RBs, and while rare, TE throws seemed to be even more efficient. This could be due to play design or defensive tendencies given cues. For example, a RB pass might come off of a handoff, and suffer more pressure from typical pass rushers given their position on the field, while WR passes might more often come from outside the tackle box, where they’d have more time to assess how the play has been defended. It could also be that former collegiate quarterbacks might often convert to receiver to play in the NFL, and thus have more relevant experience for these types of plays.
By Play Design
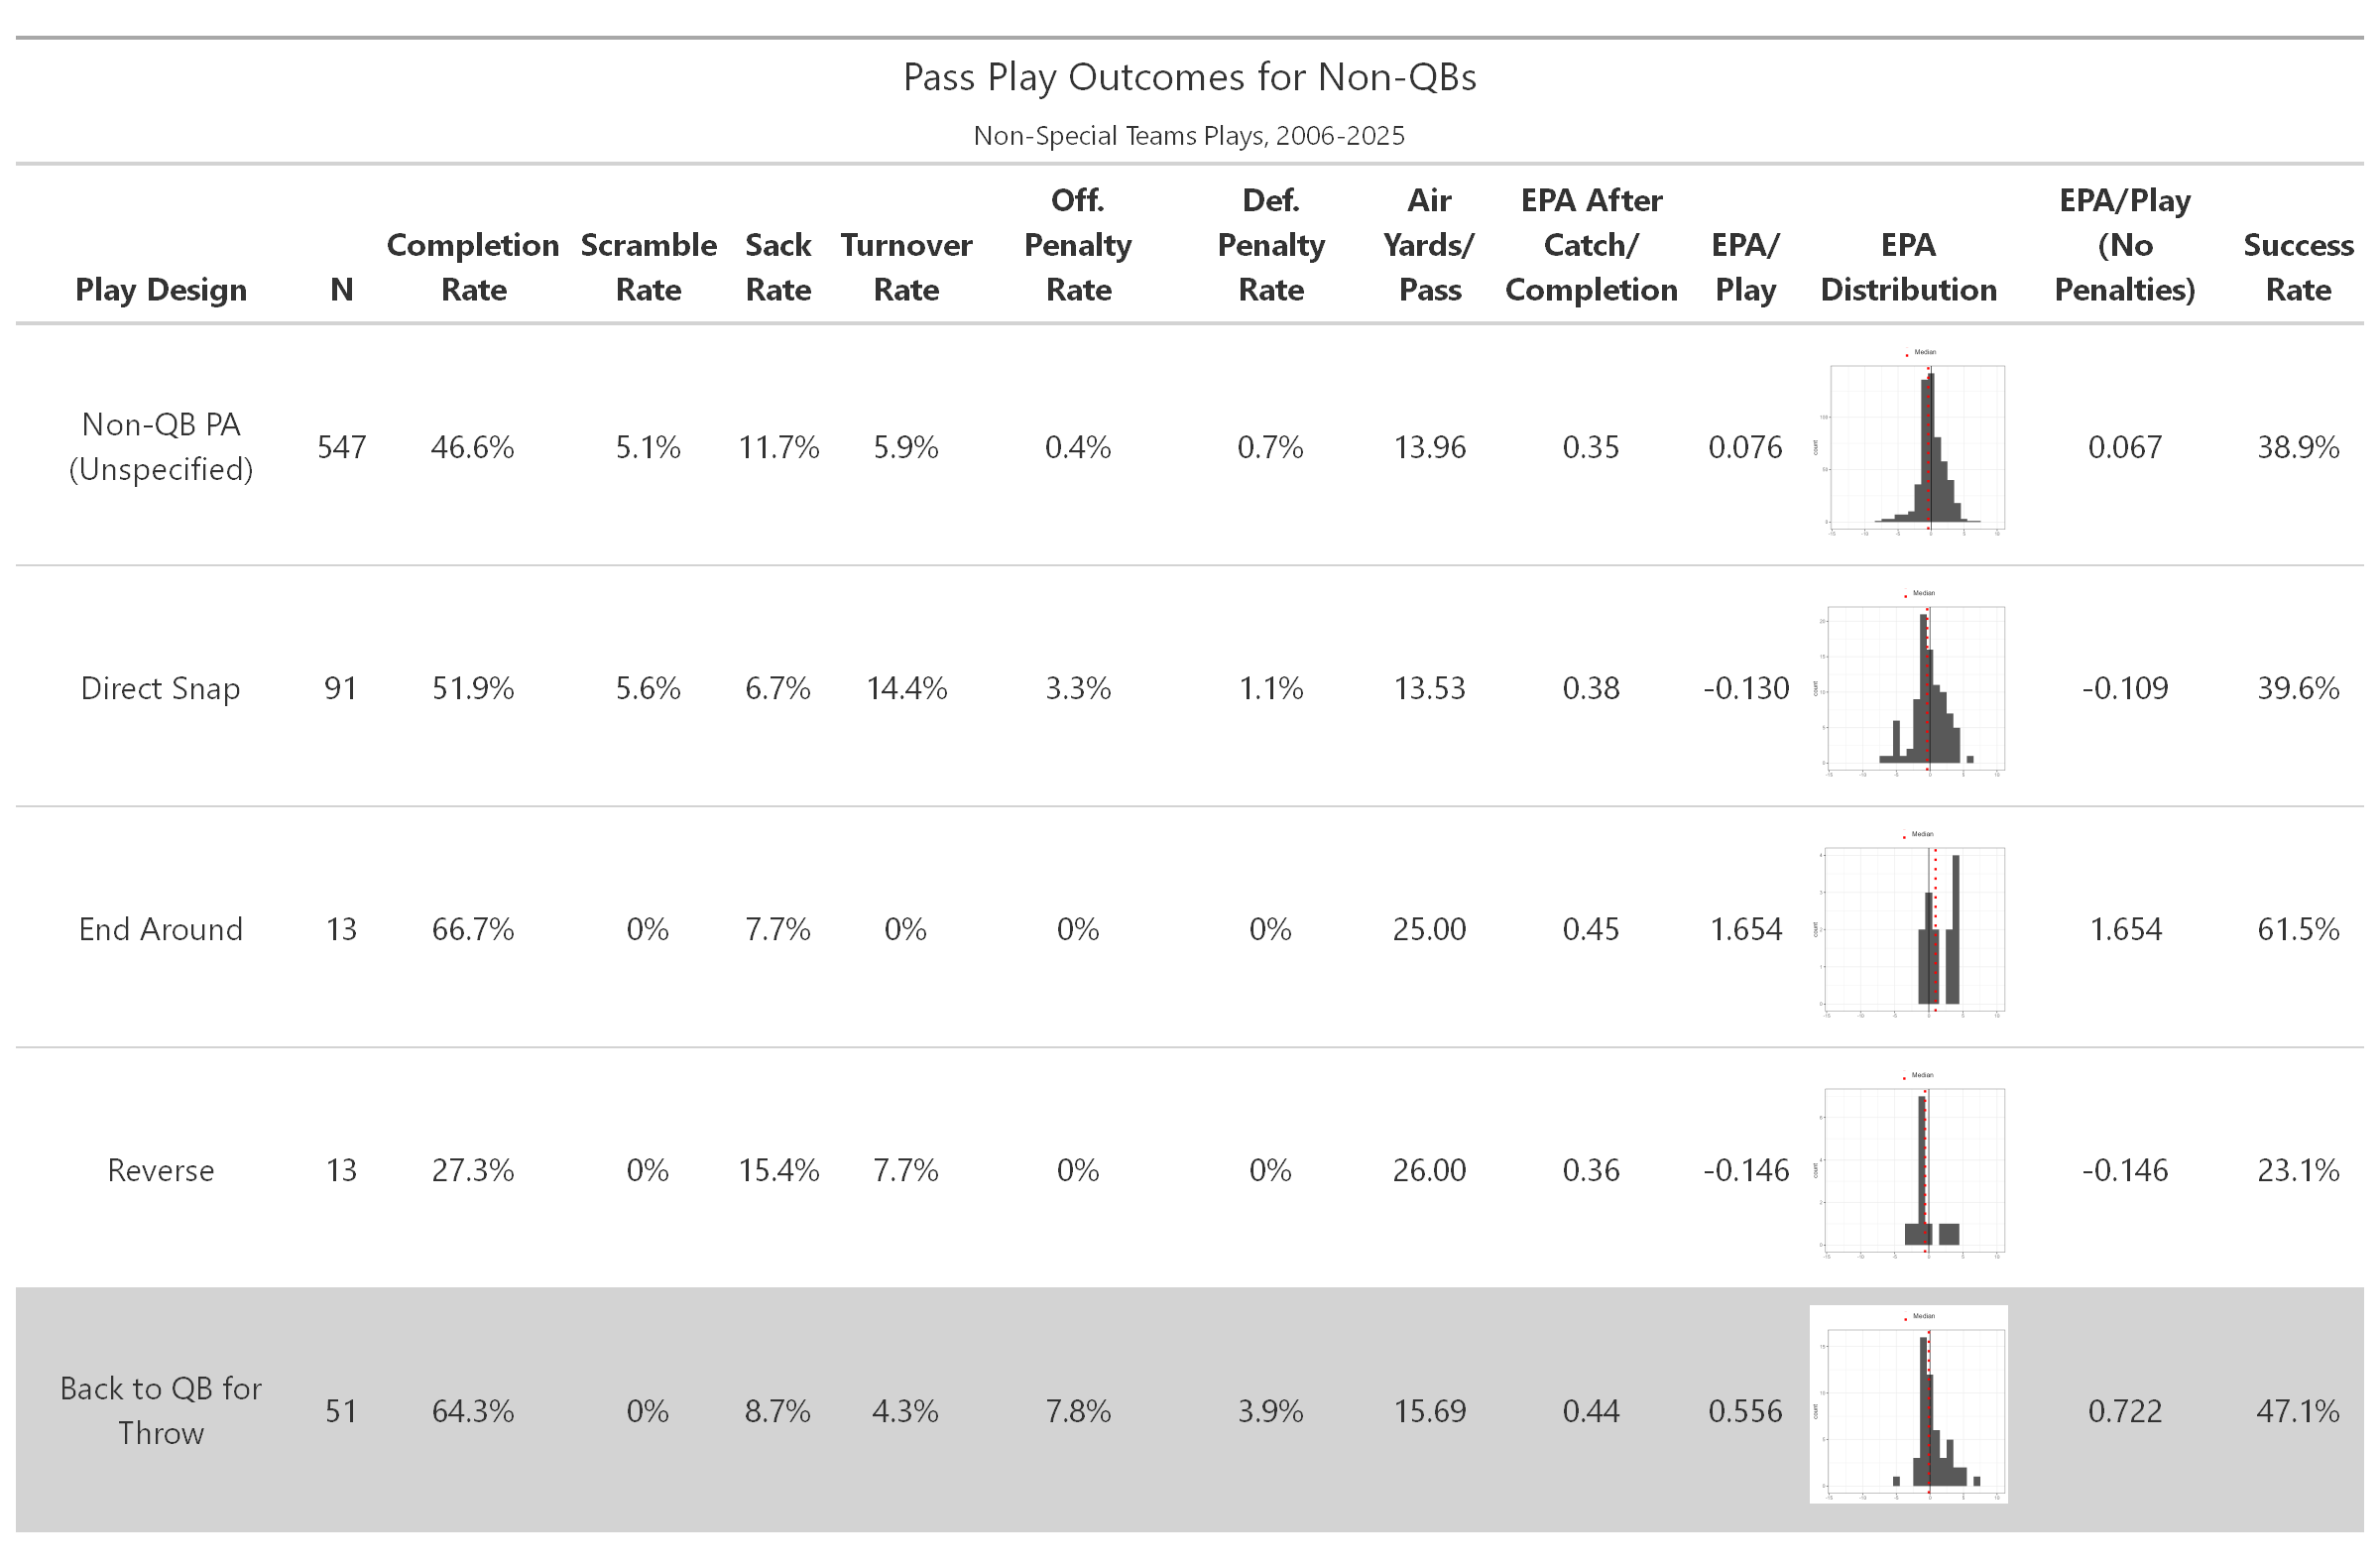
Table. Cumulative Statistics for Non-QB Pass Outcomes by Play Design (Non-QBs)
Direct snap pass plays, which skip the QB handling of the ball entirely, had a similar success rate but negative EPA on average. It might be because the QB being out of position cues an alert in the defense the makes them more prepared for anything. Very few other designs were identified. Passes off an end around appeared quite successful, but only 13 were observed and more than a third of those were thrown specifically by Antwaan Randle El. Impressively, he netted a TD on more than half of his tries, so that might skew how successful this choice would be more generally.
I also included stats for trick plays where the ball is handled by someone else but ends up with the QB to pass (gray row). That should serve as a more direct QB vs. non-QB pass comparison in a trick play setup. Those were generally more successful than the other non-QB pass plays we categorized.
By Playcaller
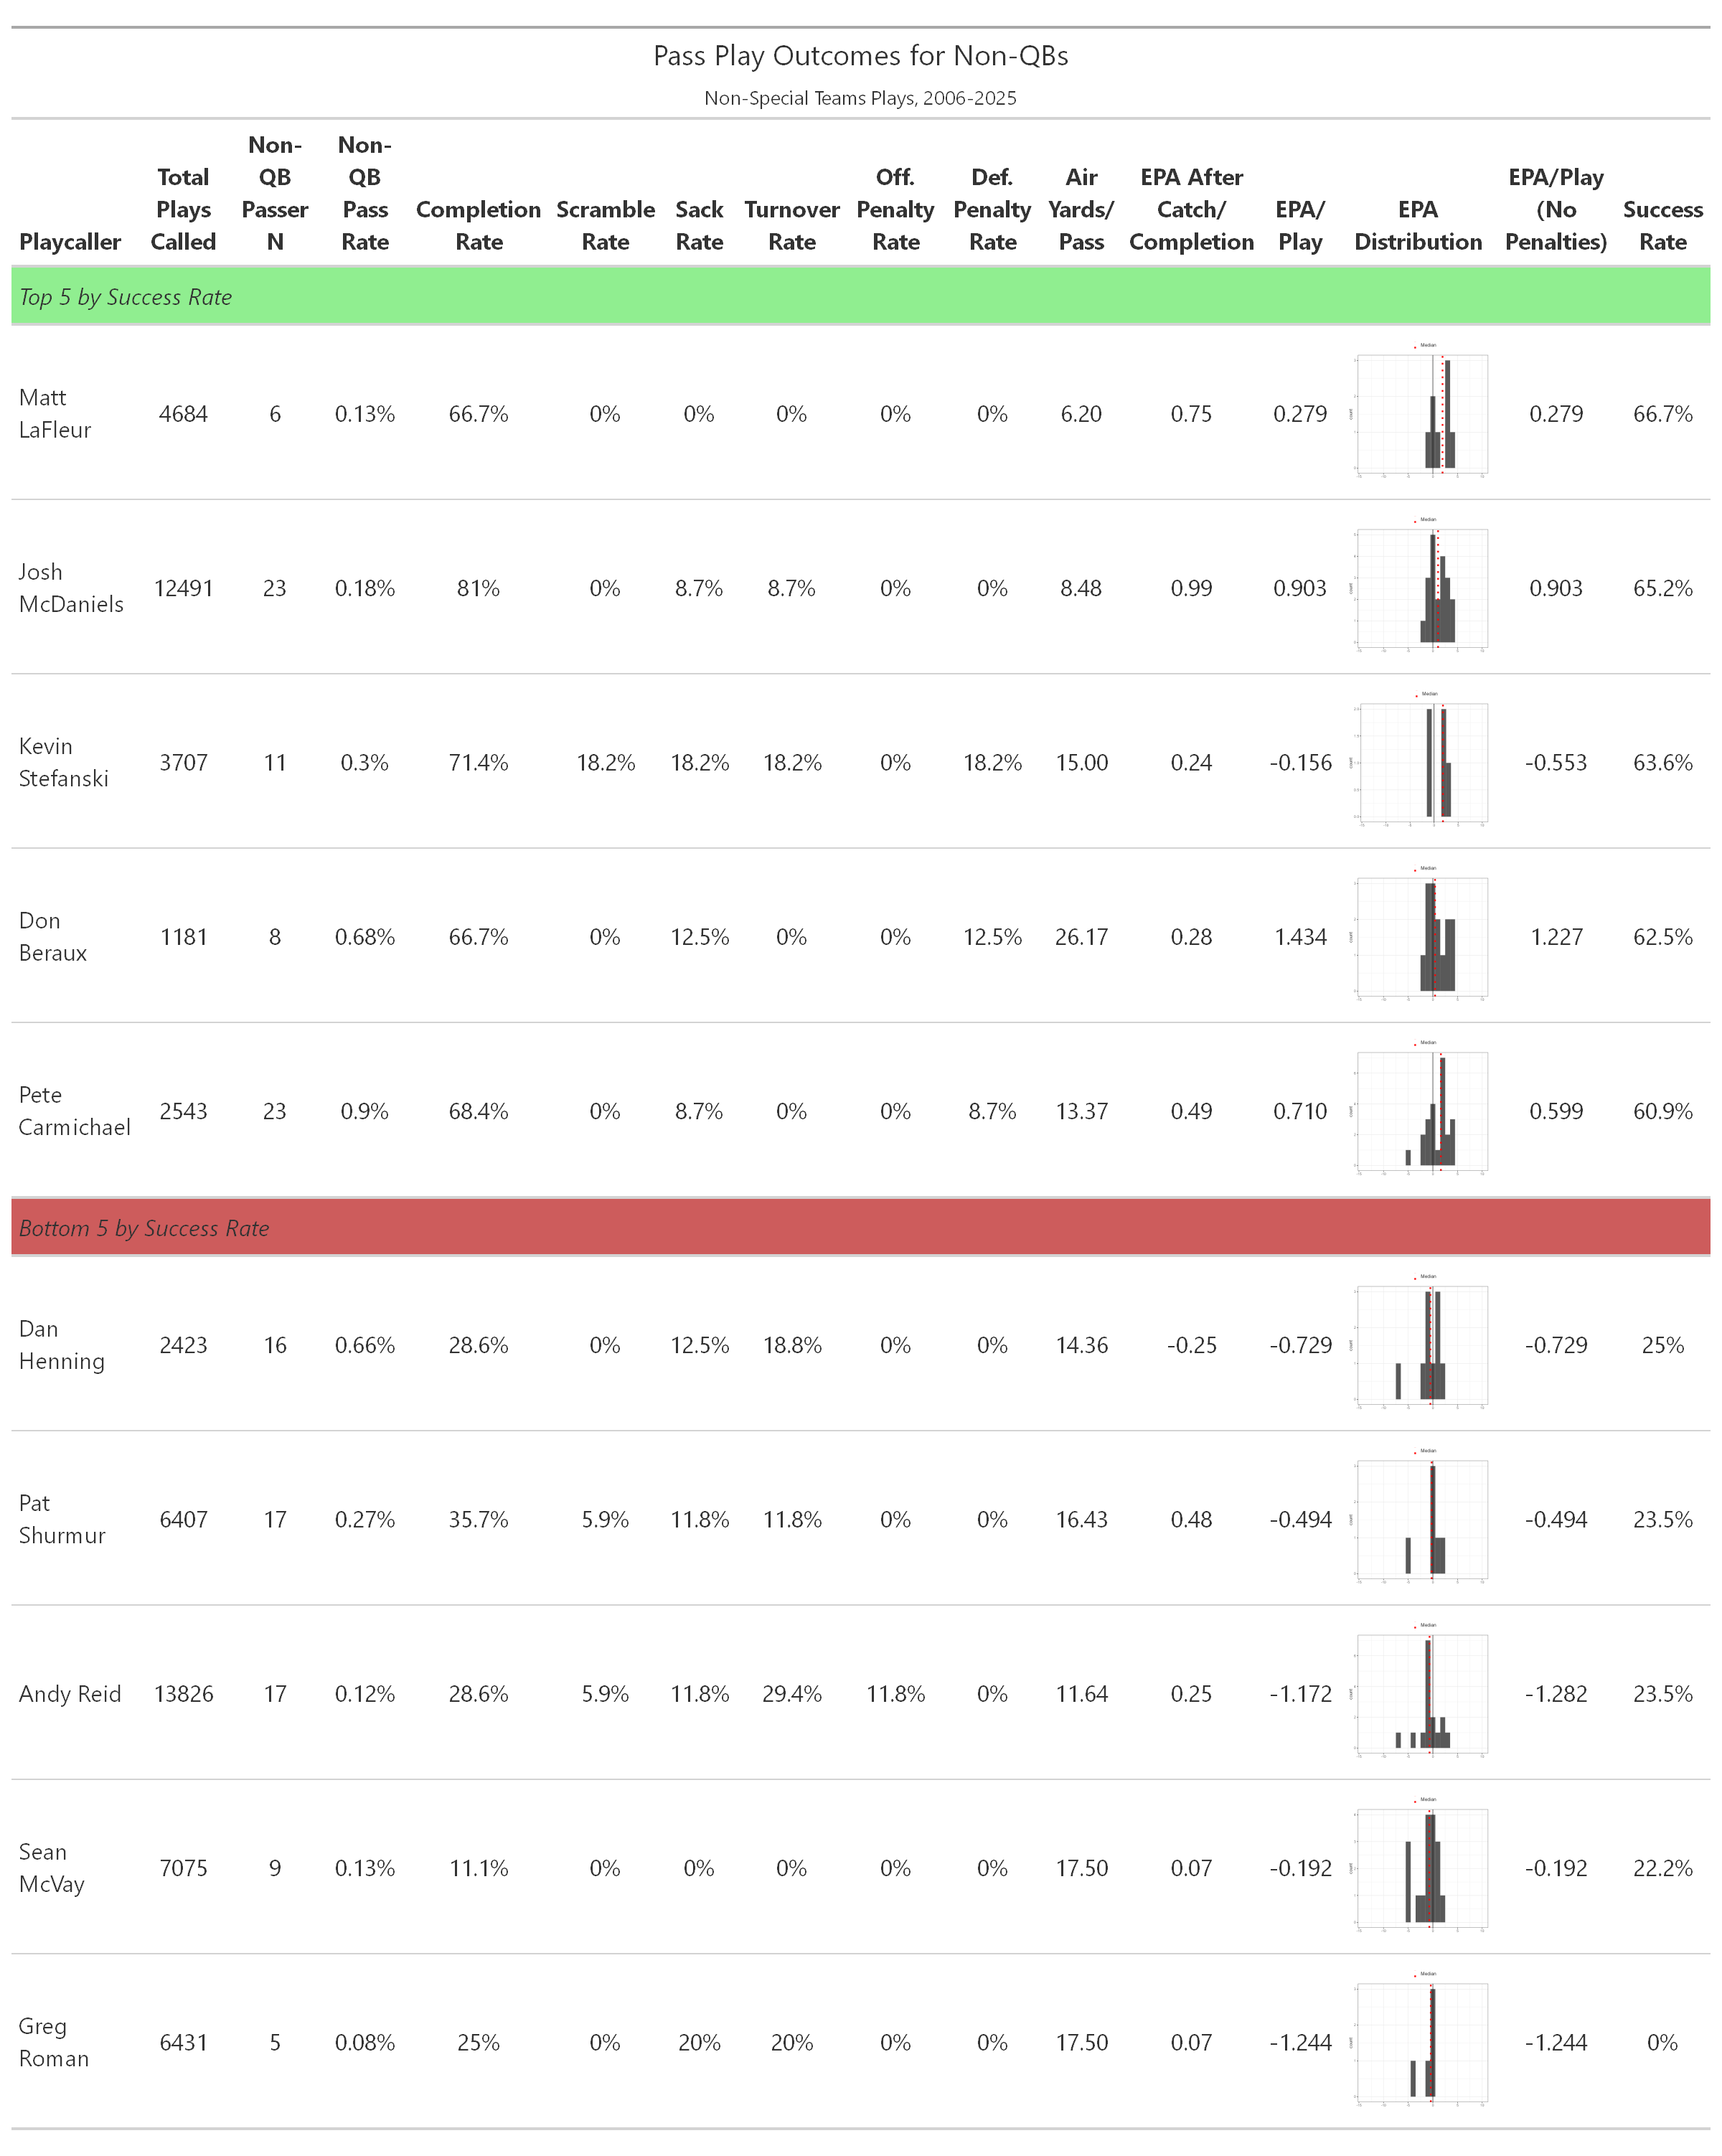
Table. Cumulative Statistics for Non-QB Pass Outcomes by Playcaller (Non-QBs)
As you’d expect, the limited number of non-QB passes makes it difficult to draw firm conclusions regarding specific playcallers. Josh McDaniels recorded the most during this time period, 23, with 46 having run at least 5 instances. McDaniels was also 2nd highest in success, trailing only Matt LaFleur (66.7%) who only had 6 non-QB passes under his guidance. On the other end of the spectrum, reputationally run-happy Greg Roman has a 0% success rate, but only on 5 attempts. Interesting, highly regarded offensive minds in Sean McVay and Andy Reid are 2nd and 3rd worst.
By Player
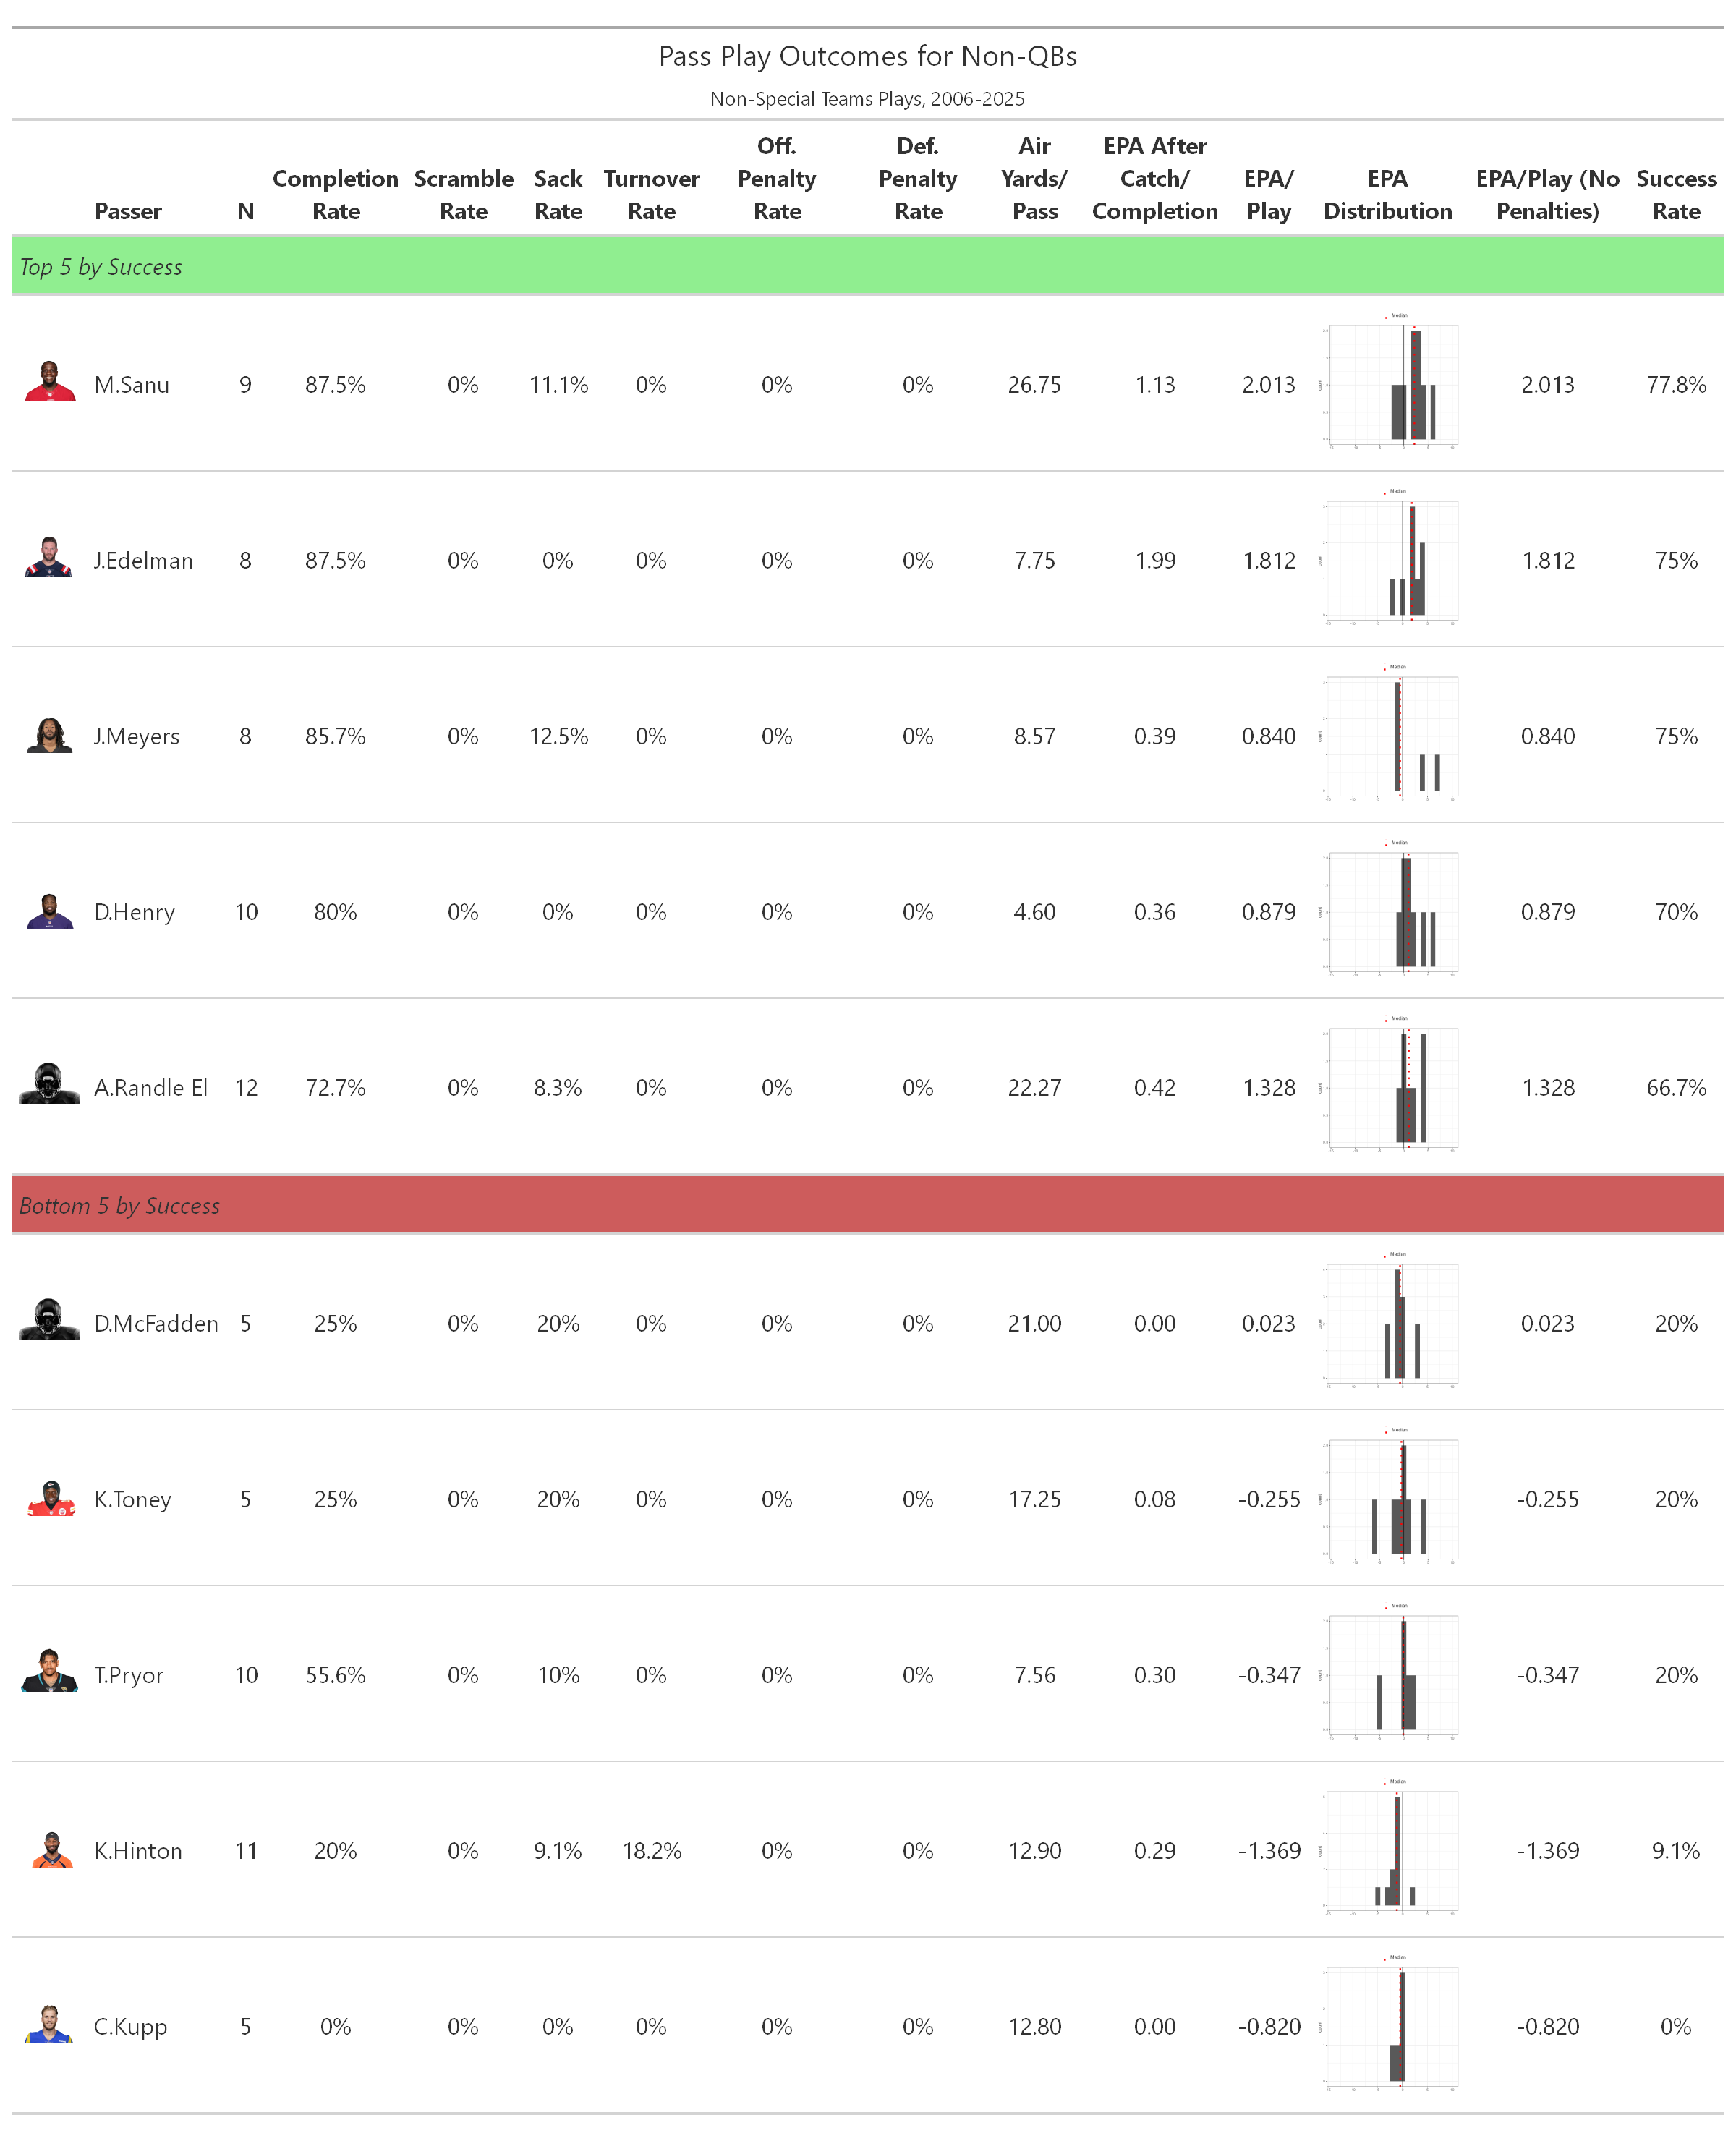
Table. Cumulative Statistics for Players in Top and Bottom 5 Non-QB Pass Outcomes According to EPA
Individual players naturally have very few of these types of attempts over the course of their careers, with multi-talent and college football quarterback Taysom Hill logging the most (25). The highest success rate falls to Mohammed Sanu, who converted 7/9 pass attempts. Derrick Henry, who is known for red zone touchdown tosses, is 4th in success with a 70% rate, surpassed by Sanu and two other players who spent even more time under McDaniels (Julian Edelman and Jacobi Myers). As for the least successful, Cooper Kupp has a 0% success rate on his 5 attempts, and wide receiver turned COVID emergency quarterback Kendall Hinton was second worst (9.1% on 11 attempts).
As stated in passing before, a number of collegiate QBs make an appearance on this list (e.g. Julian Edelman, Antwaan Randal El, Brad Smith, Terrell Pryor) to presumably take advantage of their previous experience, but that didn’t automatically point to greater success on their limited attempts.
Closing Remarks
Non-QB passes are quite often exciting plays. But despite being used in situations that are typically advantageous for passing (e.g. closer to opponent’s goal line, higher expected pass probability), they produce marginally lower EPA and noticeably fewer successes than typical pass plays. And their typical usage in pass-friendly situations means that those baseline figures likely underplay their lack of performance. Certain variants, playcallers, and pass throwers may be more productive. For example, there might a greater chance to benefit from specifically running a pass off an end around by a wide receiver. Ultimately, however, the surprise of the play itself does not consistently generate an observably positive effect.
Given the multi-faceted nature of football, there should be other circumstances that contribute to the success of these plays beyond the ones we’ve considered, whether it be specific defensive tendencies, actions induced by play sequencing, or something else entirely. But playcallers have the freedom to deploy non-QB passes against opponents and matchups and occasions they consider favorable, and still create no consistent gains on the whole. It could be that the purpose of these plays extend beyond the play itself, planting seeds of doubt in a defense to slow the pursuit to the quarterback on other plays. If so, the benefits would obviously manifest beyond these specific plays, but it would be more complicated to quantify.
A shortcoming of this work is that it is reliant on the play coder being able to detect whether a pass has been called for a non-QB which may be difficult if they don’t pull back their arm to actually throw, so some planned non-QB passes might just be coded as runs, either for a gain or loss. Some of these plays are likely designed to have an option to run or pass, so binning them into two separate classes would be misleading. This is also arises when false starts are called–there’s no evidence that a trick play was called, but the call might have caused enough anxiety to make one much more likely. A team with actual playcall information could classify these with confidence, but I would doubt this would be shared across the league in a manner to provide enough instances for analysis. Given all this, I would expect our ability to identify instances of non-QB passes to be more limited, but to also be confident in the ones we have identified.
Addendum - Special Teams Passes
I did have production split out for the instances where special teams formations were utilized as well, which are below. Overall, it seems like passes out of punt formation were more productive, while those off place-kicking formation do relatively poorly.
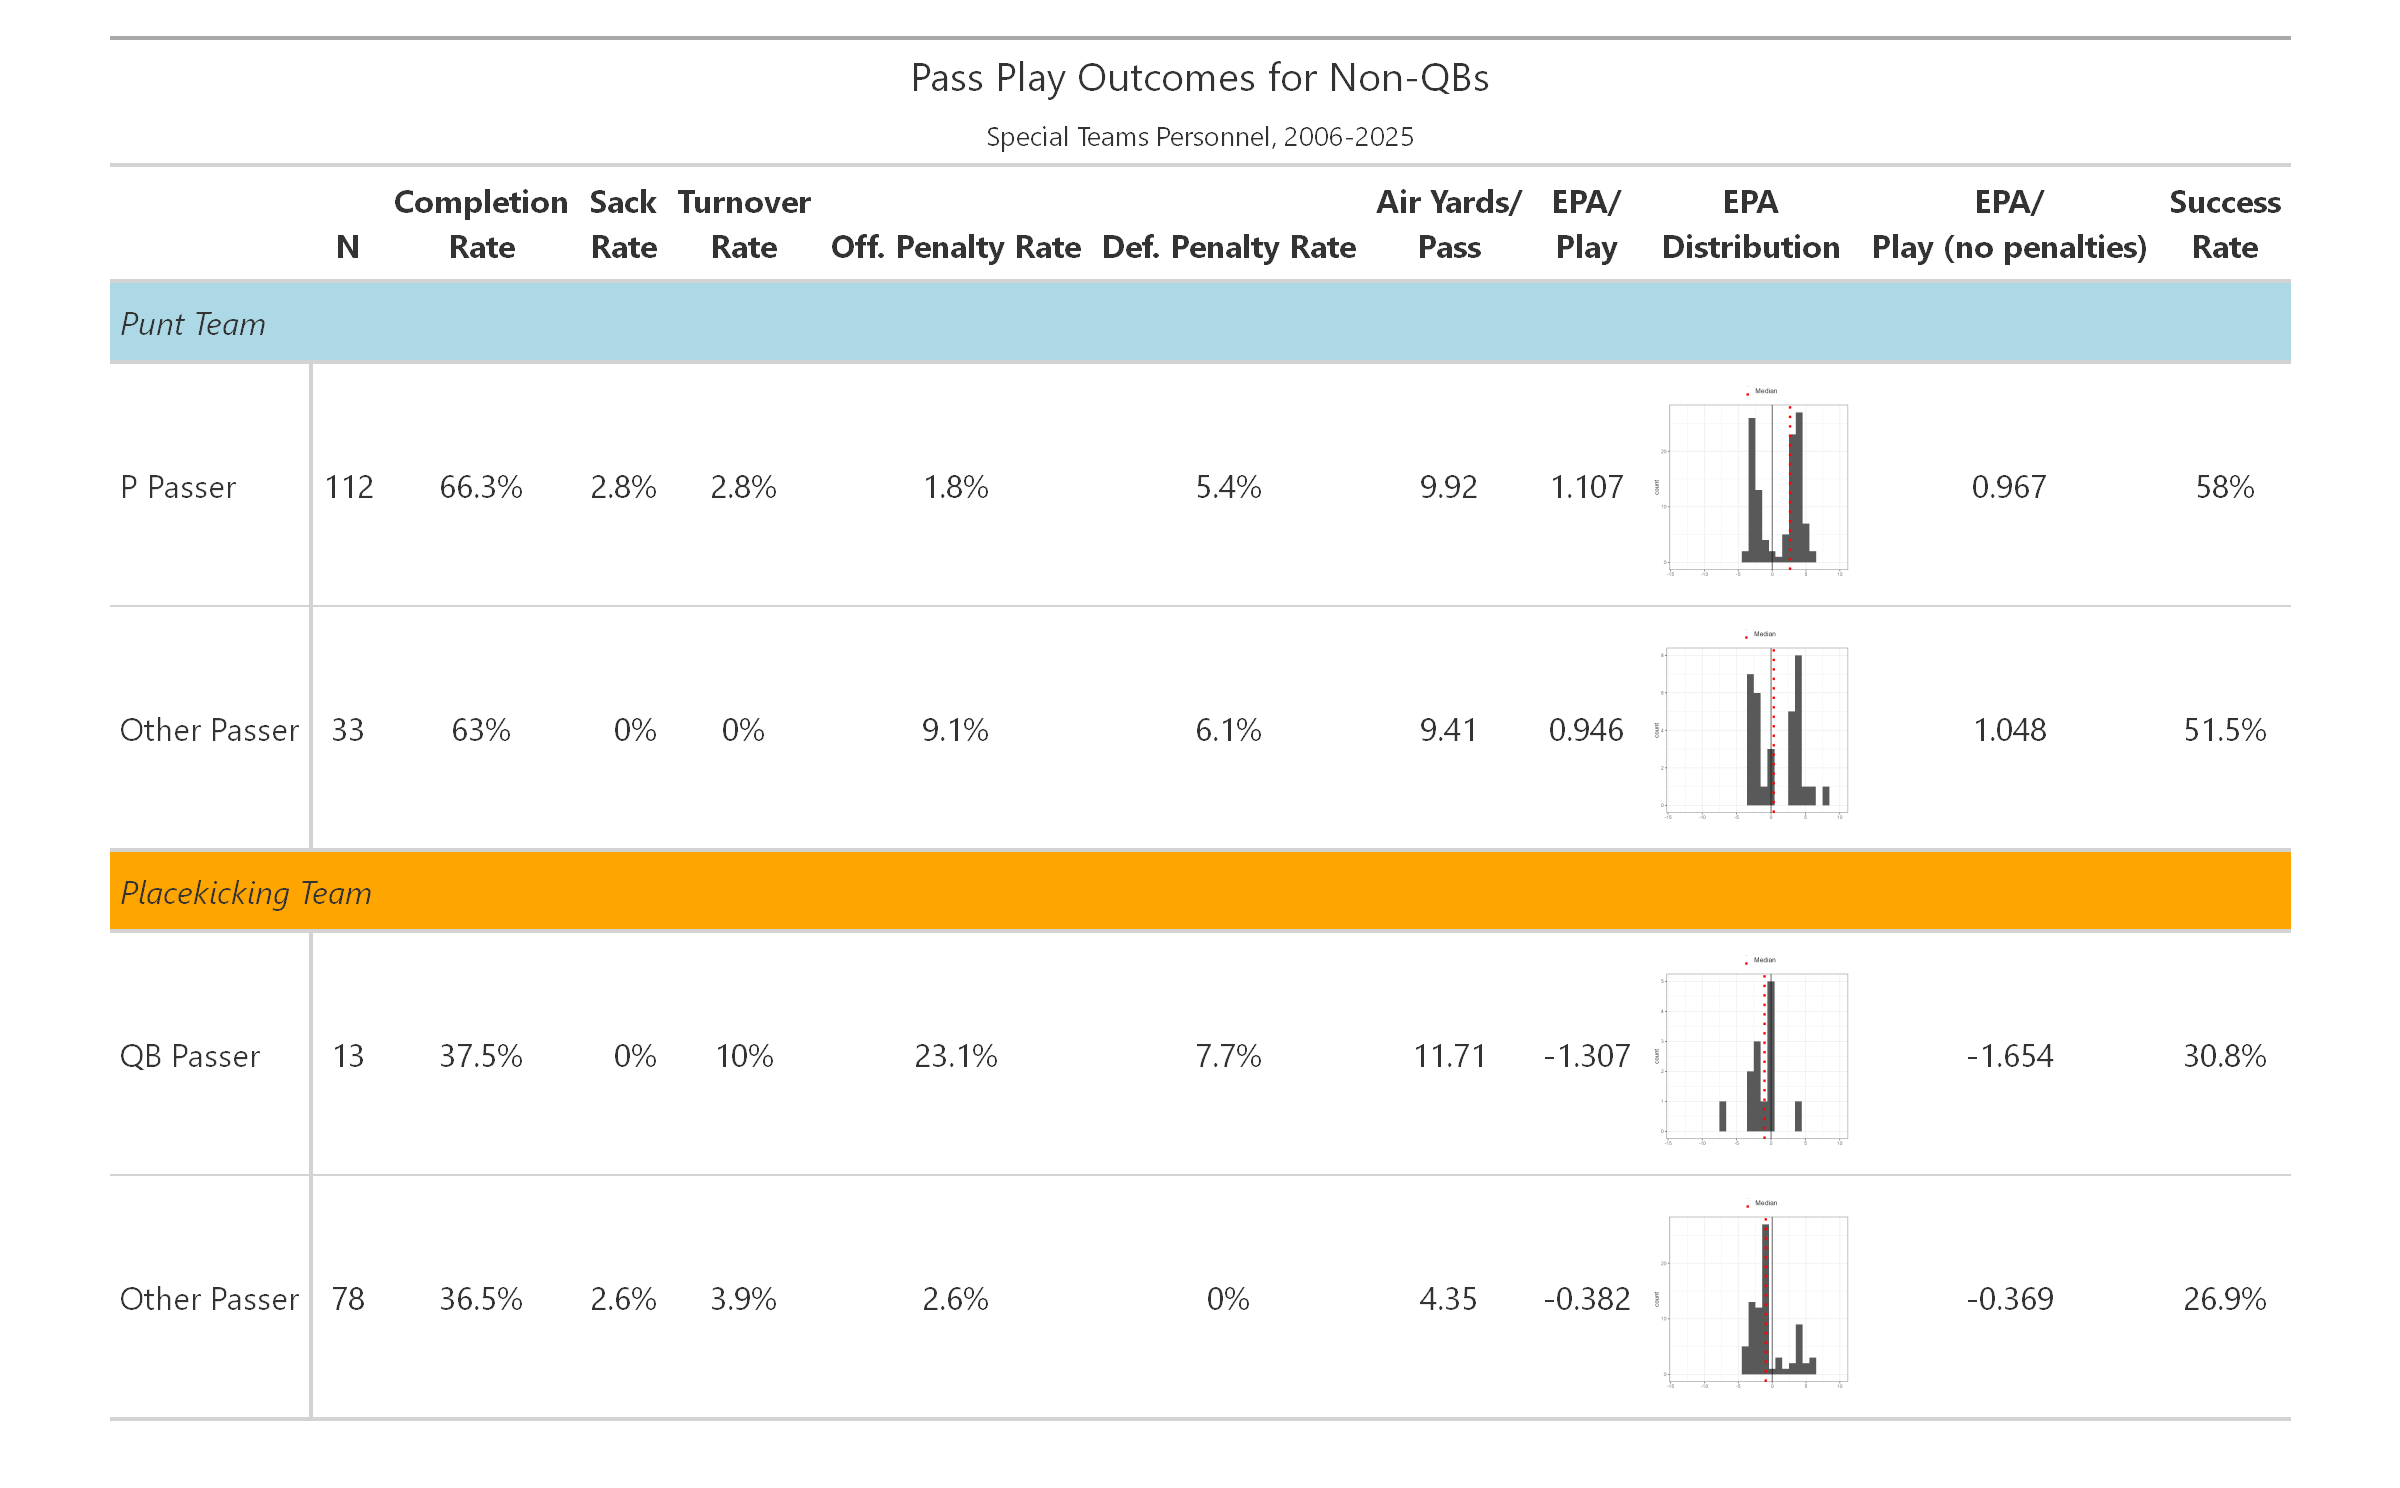
Table. Outcomes for Pass Play Outcomes Run Out of Special Teams Formations