
The NFL has been presented as a model of competitive parity for professional sports. Their use of hard salary cap and revenue sharing works to keep teams on a more level playing field by preventing any one team from leveraging a larger bankroll to buy wins. The draft order set from worst to best record, coupled with a rookie wage scale, should give worse teams better access to young talent and allow them to keep them on a cost-controlled contract for an extended period. And when success finds a team, free agency and higher asking prices make it more difficult to retain the talents that brought them there. Ultimately, it all works in tandem to provide barriers to any one team dominating consistently.
The NFL is also a copycat league, and if any one team shows success in these conditions, the others will try to mimic it to assimilate whatever competitive advantage the standout has gained. But how does an organization identify who to take lessons from? One season could just be a flash in the pan, influenced heavily by injury luck, favorable schedules, or other bouts of serendipity. Emulating strategies and moves by those teams could lead a team down a dangerous path that could be costly in both time, money, and fan goodwill. Fortunately, statistical analysis is powerful tool for identifying trends that are real and those that are likely due to chance. Below, we’ll assess team finishes over the last 10 years and pinpoint which teams who have been consistently better or consistently worse than their competition. That analysis will allow us to identify which organizations are truly “built different”. These teams are the ones that transcend the mechanisms of parity through some combination of roster building, staff selection and retention club culture, and organizational priorities to find either regular success or regular failure, and they are the ones that may be most worth learning from.
Exploration Aim
- Objectively determine which NFL teams show patterns of success or failure
Data & Methods
Just a quick data introduction:
The data for this is quite simple–a dataset recording where each team finished in their division, from 1st through 4th, over the last 10 seasons (2015-2024). With that (and some columns marking wildcard appearances and Super Bowl wins), I generated the visualization below. (Editor’s note: To be perfectly honest, I just wanted to create this visualization to see how the NFC East looks given their lack of a repeat winner since 2004. The research question and analysis were built around it.)
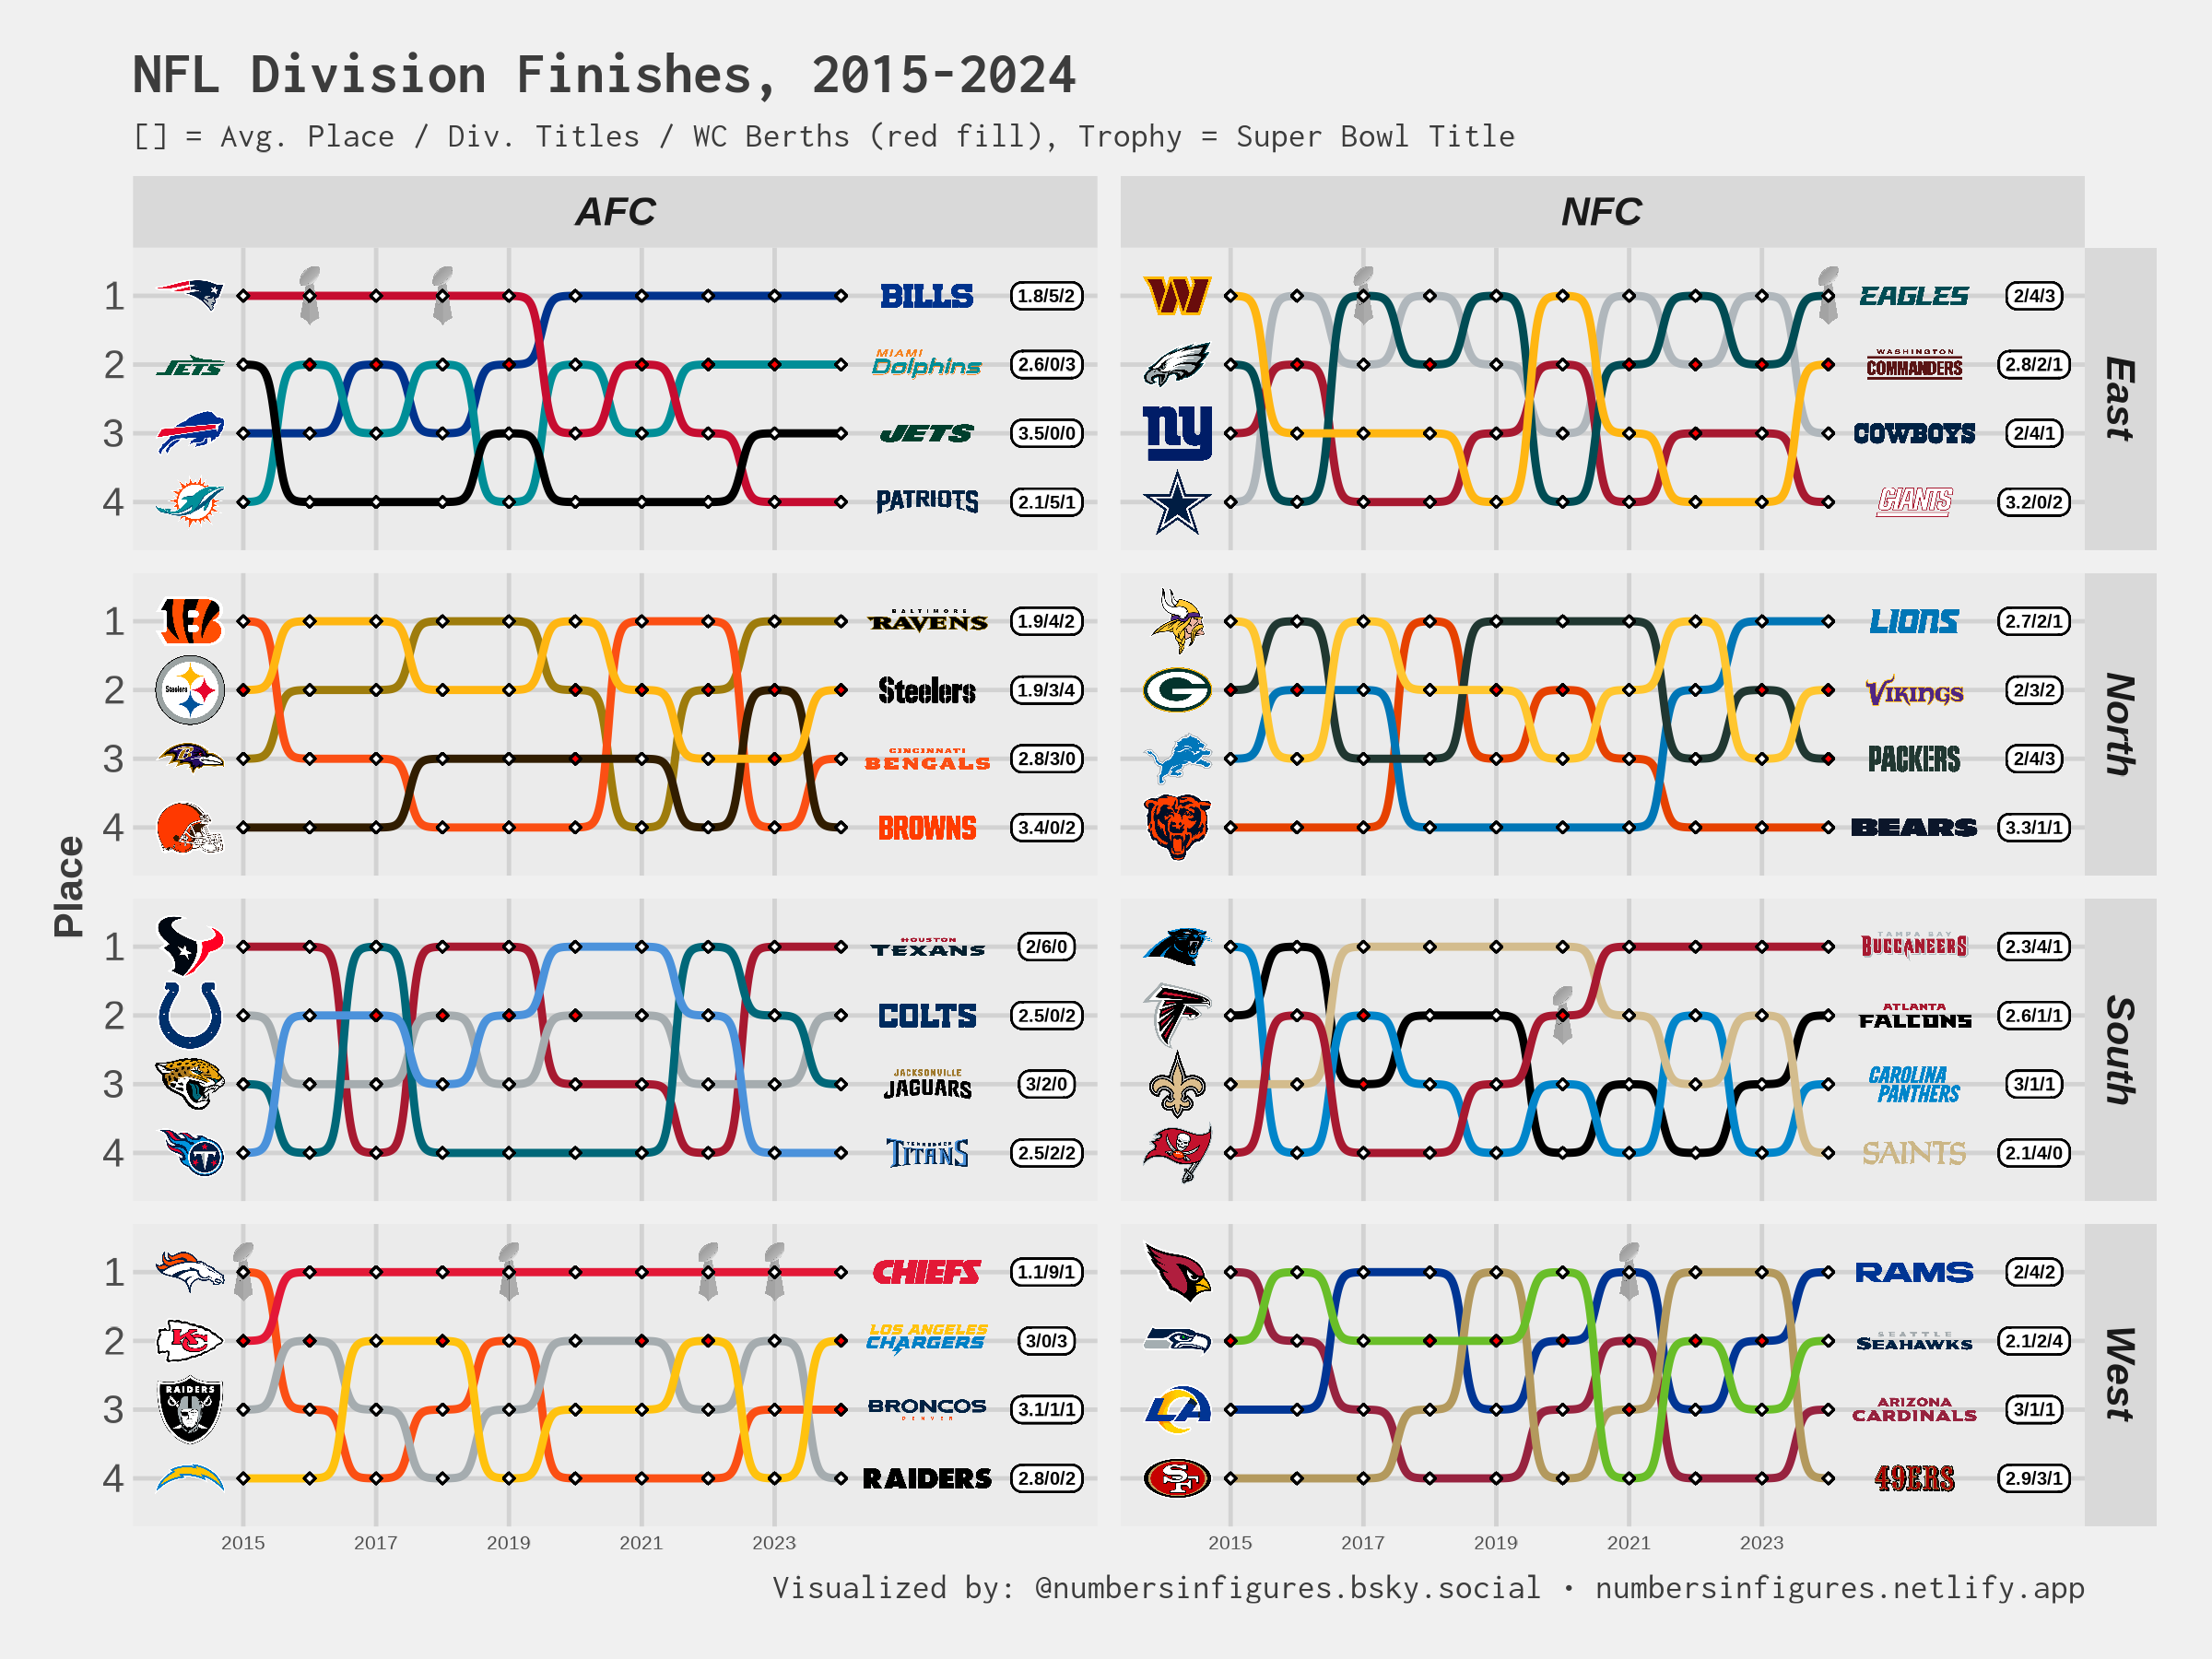
For this research question, I’ll separate the data into each division. Any exceptional teams should hopefully demonstrate it quite convincingly against the set of teams they have to play twice a year. Narrowing the focus to the division-level also controls fairly strongly for schedule, since division competitors face mostly the same teams outside the division over the course of the season.
I’ll use a non-parametric method, the Friedman test (alpha = .05), to essentially see whether the pattern of rankings differ for teams across the 10 years more than would be expected if team didn’t matter at all. For divisions demonstrating evidence of non-parity, I’ll then use post hoc pairwise analyses (Wilcoxon sign-rank tests) to see if any particular team sticks out as exceptionally good or bad, applying a Holm adjustment to mitigate the issue of multiple comparisons.
These statistical analyses were done in R with the rstatix package.
Results
| Friedman Test Results by Division | ||
|---|---|---|
| Division | Statistic | P-value |
| AFC East | 9.96 | 0.019 |
| AFC North | 9.72 | 0.021 |
| AFC South | 3.00 | 0.392 |
| AFC West | 16.00 | 0.001 |
| NFC East | 6.48 | 0.090 |
| NFC North | 7.08 | 0.069 |
| NFC South | 2.76 | 0.430 |
| NFC West | 4.92 | 0.178 |
| Kendall's W Effect Sizes by Division | ||
|---|---|---|
| Division | Effect Size | Magnitude |
| AFC East | 0.33 | moderate |
| AFC North | 0.32 | moderate |
| AFC South | 0.10 | small |
| AFC West | 0.53 | large |
| NFC East | 0.22 | small |
| NFC North | 0.24 | small |
| NFC South | 0.09 | small |
| NFC West | 0.16 | small |
Tables. Statistical Significance and Effect Size Tests for Division-Level Ranking Patterns
Given the 10 years, we only find three divisions that produce rankings patterns that would be unlikely due to chance. The effect sizes for the AFC East and North were judged to be “moderate” (0.32-0.33), smaller than the “large” effect of team in the AFC West (0.53). Upon re-examining the visualization, the AFC West is probably no surprise, as the Kansas City Chiefs have held the top slot for the last 9 years. The AFC East follows logically, since the Division Crown has between shared equally, with 5 straight years for the Patriots followed by 5 straight for the Bills. The last division showing a statistical lack of randomness is the AFC North, which seems hard to pick out visually, even though the calculated effect size is quite similar to the North. But the second step might be helpful for that.
| Pairwise Comparisons with Adjusted p-values | ||||
|---|---|---|---|---|
| Team 1 | Team 2 | Raw P-value |
Holm-adjusted Rejection Value |
Statistical Significance |
| AFC East | ||||
 |
 |
0.012 | 0.010 | ns |
 |
|
0.029 | 0.007 | ns |
|
 |
0.052 | 0.006 | ns |
|
|
0.094 | 0.006 | ns |
|
|
0.468 | 0.004 | ns |
|
|
0.604 | 0.003 | ns |
| AFC North | ||||
 |
 |
0.011 | 0.012 | * |
|
 |
0.013 | 0.008 | ns |
 |
|
0.119 | 0.005 | ns |
|
|
0.236 | 0.005 | ns |
|
|
0.347 | 0.004 | ns |
|
|
1.000 | 0.003 | ns |
| AFC West | ||||
 |
 |
0.005 | 0.050 | * |
|
 |
0.005 | 0.025 | * |
 |
|
0.008 | 0.017 | * |
|
|
0.524 | 0.004 | ns |
|
|
0.753 | 0.003 | ns |
|
|
0.834 | 0.003 | ns |
Table. Statistical Significance Tests for Differences between Teams Within Divisions
Reviewing the pairwise tests, we can say with confidence that the Kansas City Chiefs have been better than each of the remaining teams in the AFC West. Referring back to the original figure, this is finding is almost just a formality, as placing 1st in 9 out of 10 years is a pretty powerful pattern. As for the AFC North, the Browns were tagged as significantly worse than the Ravens. Coincidentally, though, the Steelers were tied with the Ravens in mean rank, but was found to be not significant indicating how borderline those results were. That would indicate that the Browns’ futility was driver of the non-random pattern in that division.
Closing Remarks
With this work, we’ve applied an objective method to identify standout performances for NFL teams. Only 3 of the 8 divisions and 2 team showed results that analysts would consider typically consider statistically significant. Still, those patterns persist despite the comings and goings of players, coaches, and staff over the years. Given the results, a closer examination of organizational practices employed by the Chiefs over the last decade may be the best roadmap. Still, this does feel like one of those obvious “water is wet” findings, and while it was intended as more of a fun exercise, I was hoping for a little more.
There are, of course, some caveats to note. One is, in fact, the lack of power that may have come from using division placement. Those rankings, and specifically the division titles that guarantee playoff spots, are an important measure of success. But they might over- or under-emphasizing true differences between the teams. Depending on how well they adhere to distribution assumptions needed for parametric tests, continuous outcomes of success may be the better option. Rising above those outcomes is the assertion that winning the Super Bowl is theoretically the true goal for all these clubs, and anything less might result in high variance team decisions to target that specific aim and the expense of lower levels of success. But given its rarity, choosing that endpoint is quite limiting.
This analysis also provides a layperson with a feel for how common some results might be if there were no differences at all. Identifying findings that would only occur 1 in 20 times due to chance is a pretty stringent cutoff. It makes us focus on results that, if generated from equally good teams, would be more rare than getting 4 heads in 4 coin flips. If one is a position to stomach more Type I errors, a move to alpha = .10 could be made. For the curious, that would increase the significant findings to include the New York Jets’ poor showing compared to the Buffalo Bills in this analysis.
A deep dive into the organizational strengths of the Kansas City Chiefs and the weaknesses of the Cleveland Browns would be merited at this point. How their successes/struggles can certainly be linked to distinct ideas around talent identification, roster management, and organizational philosophies. I, however, would prefer to research from larger sample. I would retry this analysis with a continuous outcome and see if I could get more power to separate more successful and unsuccessful teams from the rest of the pack. But hopefully, what I’ve shared thus far provides some insight that might be applicable to your questions, research or otherwise.