
The 2025 season is over, the NFL Combine has come and gone, and preparations for the upcoming season are at full throttle. This period is vitally important to the many teams in the market to pick up a new starting quarterback in the draft or free agency, given how dependent a season’s success is on competency at the position. Mock drafts commonly have Indiana quarterback Mendoza as the top pick in the draft, with the Consensus Big Board showing Ty Simpson as the only other QB with first round value floating around the mid 20s, and nothing in the Combine indicates a dramatic change in the situation. While opinions evolve throughout the draft process, confidence in this year’s QB crop to be able to helm a team in their rookie year is clearly low. Given a widespread need at the quarterback position across the league, needy teams should be taking a long look at NFL veterans who might become free agents or would be poachable from other teams for reasonable compensation.
Here, I’ll look at statistics for quarterback play in the NFL during the 2025 season to help assess the performance of players likely not slated to be the 2026 starters for their current team, especially in relation to expected starters on their team. Through this, we hope to identify players who have performing well in limited snaps on an absolute or relative level. This would provide grounds for teams to focus on these candidates to see if their abilities and attributes might be a good fit for specific teams.
Data
The NFLverse package for R was used to source play-by-play data. These were filtered to plays where the quarterback either dropped back to pass or carried it on an intentional run play to focus on their direct involvement. I also ignored kneels, spikes, aborted snaps, and enforced penalties where the QB was not the culprit to more keenly focus on their performance.
Expected points added (EPA) aggregated and the mean was reported. To dive deeper into their performance, rates for completions, sacks, interceptions, scrambles, and run plays were calculated, as was the average completion rate over expected (CPOE) to provide a performance metric with some situational adjustment. For additional context, average expected pass probability was calculated from the same data, as was a snap-weighted average defensive DVOA computed using end-of-season values reported by FTN to provide a rough assessment of defensive opposition difficulty.
“Presumed 2026 Starters” were identified as players currently on a team’s roster most likely to start for that team in 2026, based on my general understanding of each team’s circumstances, even if that team was expected to acquire external help.
From this data, visualizations in the form of a graphic focused on EPA and a table compiling the metrics were created. To assist with discussion, I also calculated t-tests between teammates to evaluate differences in EPA statistically.
Visualizations
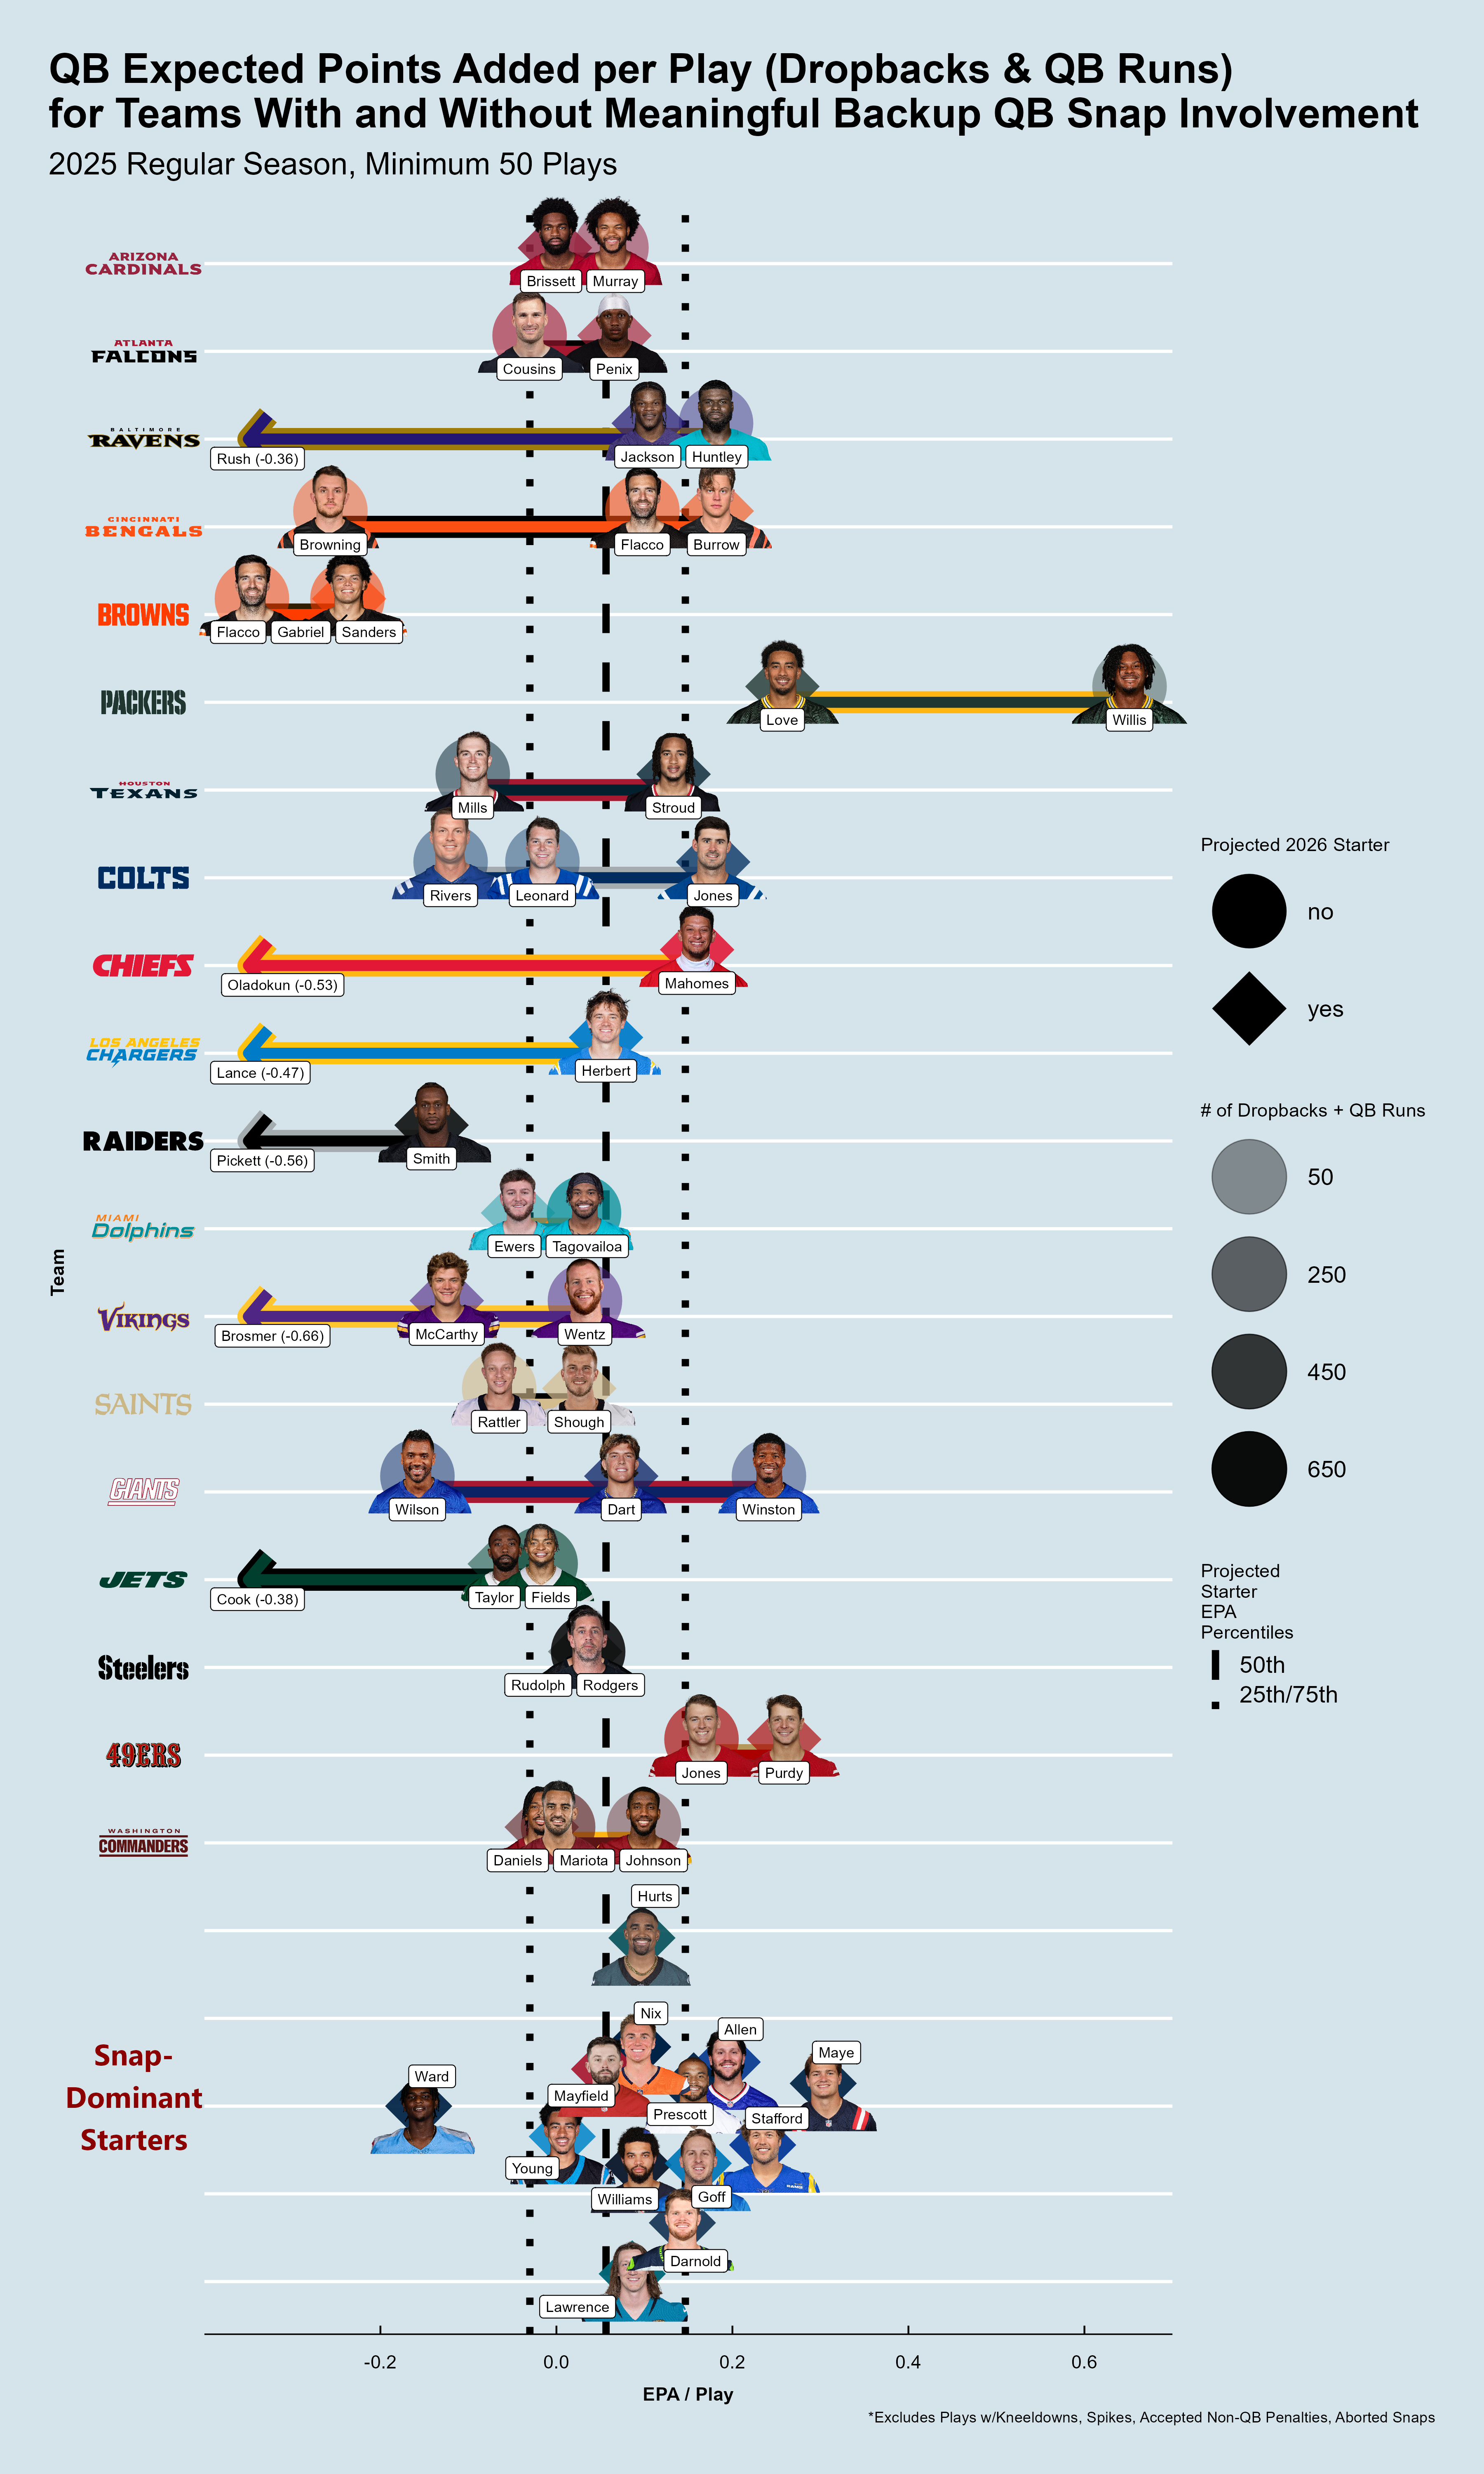 Figure 1.
Selected QB Statistics for Dropbacks/QB Runs, 2025 (minimum 50 plays)
Table 1. Excludes kneeldowns, spikes, aborted snaps, accepted non-QB penalties.
Observations
I think it makes sense here to organize the prospective QBs into higher and lower performing tiers based on EPA and add some quick observations derived from their other metrics. And if I have additional knowledge, I’ll add some extra context backed by sources such as advanced metrics from Next Gen Stats, Sumer Sports, and Pro Football Focus.
Conceivably Available QBs for 2026
Tier 1: A New Hope?
(EPA Above 75th Percentile of Presumptive Starters)
These players achieved standout performances that teams would probably be ecstatic to replicate in their own situation, and provide enough of a ceiling to make a playoff run believable.
Malik Willis (EPA: 0.65)
Age: 26
Contract: Unrestricted Free Agent
Malik Willis is the obvious eye-catcher, statistically outperforming both the starter Jordan Love and all other qualifying quarterbacks this season, albeit with the immediate caveat of limited playing time. More quickly follow, as his numbers reveal the highest rates of scrambles and runs, both being strong outliers which would be very difficult to replicate. He was also playing on downs at the lowest expected pass rates, so defenses facing him were more likely to have to account for both run and pass more than others, though that might partially be because he is creating advantageous down and distance via successful plays. He presumably benefited from the Packers’ skilled offensive architect, Matt LaFleur, who also guided Love to the 4th best EPA on this list. A counterpoint is that the receiving corps in Green Bay lack inarguable superstars, so it signals that his numbers at least aren’t the result of simply tunneling on a superhero pass-catching option, and that he can do some good work within a designed offense.
Jameis Winston (EPA: 0.24)
Age: 32
Contract: NYG through 2026 (with an out per Spotrac)
Surprisingly, Jameis Winston is next on the list, topping breakout teammate Jaxson Dart and doing so despite being on the low side for completion percentage and scramble and run rates. It seems the classic high risk deep throwing we’ve come to know from Jameis is still alive and well, as other sites have his average depth of target at what would be fourth among QBs qualifying here. It should be noted that any comparison with Dart might be complicated by head coach and playcaller Brian Daboll getting fired after the 10th game of the season, replaced by Mike Kafka.
Tyler Huntley (EPA: 0.18)
Age: 27
Contract: Unrestricted Free Agent
Tyler Huntley clocks in with the next highest EPA, coupled with a very good CPOE. He’s someone I’ve discussed before, with some more in depth modeling predicting a substantial dropoff in EPA from Lamar Jackson even in his Pro Bowl alternate year. Still, in four prior years serving as Jackson’s understudy, he did post a respectable -0.1 EPA over 21 games and 50 dropback/runs. And this year’s performance was under an offense orchestrated by a different playcaller, Todd Monken. However, the counterargument toward his flexibility would be last year’s showings as the backup for Miami, which were less successful. He also had a fairly high scramble rate and placed top three in designed run percentage, which may be difficult to sustain over longer stretches. But given his UFA status, he might actually be worth another look to see whether a new team could build around his strengths.
Mac Jones (EPA: 0.16)
Age: 27
Contract: SF through 2026
Mac Jones performed admirably for a hurt Brock Purdy over a substantial stretch, though he is the only one in this group that posted lower per-play numbers than the starter. One concern regarding the possible transferability of his success is that Shanahan-designed offenses are consistently efficient. Looking back to his Patriot days, Jones had mixed results under the three playcallers, doing his best work with Josh McDaniels his rookie year, predictably struggling under makeshift offensives of Matt Patricia/Joe Judge his second year, then producing inconsistent results under Bill O’Brien. A Press Taylor-directed stint during a season with the Jags also failed to impress. But this year with Shanahan may indicate growth after the lack of stability, and he could follow the path Sam Darnold has taken in finding success at other clubs. So whether his recent success will translate to another team is a valid question, but he should be worth further investigation.
Tier 2: Steady Hands?
(EPA Between 50th and 75th Percentile for Presumptive Starters)
These players provided some evidence last season that they can be solidly productive in certain circumstances, and could be worth trusting to steer a team towards competency, if not legitimate success.
Josh Johnson (EPA: 0.10) - Earned the best EPA for Washington, albeit on very limited snaps and with a top 3 scramble rate. At age 40, has never earned a starting job for any of his 14 teams going into a season, suggesting some shortcomings.
Joe Flacco (0.10 with CIN, -0.35 with CLE) - A unique good news/bad news profile given his substantial playtime on two teams. His Bengals performance lands him here, particularly remarkable given that he had to learn the offense on the fly after the midseason trade. Of course, that Browns stint earlier in the season was brutal, and should be considered when evaluating how plug-and-play ready he might be for another team presumably without a Ja’Marr Chase. He stands as the poster boy for “situation matters”, but his improvement came with only a slight upgrade in offensive line play, and he may be a solid option for a team than can cover for his lack of mobility.
Kyler Murray (0.06) - Benched midseason but can still claim an EPA above median for NFL starters and better than his replacement. Lots of short passing yielding very low intended and completed air yards, and whether that stems from mitigating a poor pass blocking unit up front per PFF or hiding Murray’s recent deficiencies with deep throws is a question that needs to be investigated thoroughly.
Tier 3: Treading Water?
(EPA Between 25th and 50th Percentile for Presumptive Starters)
Aaron Rodgers (EPA: 0.04) - Yielded an EPA slightly lower than his backup Mason Rudolph, and with the quickest time to throw per Next Gen Stats, he doesn’t have much confidence in his evasive maneuvers at this point in his career. Would predictably benefit greatly from a solid pass blocking unit.
Carson Wentz (0.03) - Season cut short by shoulder surgery, but solidly outperformed intended starter J.J. McCarthy and 3rd stringer Max Brosmer. Performance might actually underestimate his potential, given he played with the shoulder injury for multiple games.
Tua Tagovailoa (0.03) - Benched for unsatisfactory performance after topping the league in interceptions, but was at least able to avoid serious injury behind PFF’s 29th-ranked O-line.
Marcus Mariota (EPA: 0.00; difference: +0.02 vs. Daniels) - Netted similar EPA numbers to heralded starter Jayden Daniels, and did even better in limited snaps last year. Led NGS rankings in average intended air yards, seemingly breaking with his early career reputation as a conservative passer.
Justin Fields (-0.02; difference: +0.04 vs. Taylor)- Posted similar EPA to Tyrod Taylor, with both having concerning sack rate despite offensive line play being only a bit below average per PFF. But multiple full games under 60 passing yards is intensely concerning no matter what the circumstance.
Riley Leonard (EPA: -0.02; difference: -0.19 vs. Jones) - Produced better EPA than his emergency replacement Rivers, and was only bested by Dart and Shough among rookies on this list. His interception rate was top 5 highest on this list, but his numbers were primarily posted against formidable defenses in Jacksonville and Houston, the most difficult snap-weighted opposition listed.
Tier 4: Rescue Operation?
(< 25th Percentile for Presumptive Starters But EPA Statistically Similar to Team’s Starter)
The hope is that both the starter and backup struggling is evidence that the setting was the issue, and that these players are capable of thriving in a better situation (and that your team is able to provide that situation).
Dillon Gabriel (EPA: -0.24; difference: -0.00 vs. Sanders) - Benched for poor efficiency and conservative play, reflected by low CPOE, aDOT and Air Yards to the Sticks (NGS). Not known to be a toolsy thrower, so he probably needs a protected environment to give him more time to adjust to the NFL.
Tier 5: Miscast?
(< 25%ile While Team’s Starter Produced > 25th %ile Performance)
The hope in this group would be that their skills weren’t as good a fit as the starter for personnel or schematic reasons, and that your team could better develop and make use of them.
Kirk Cousins (-0.03; difference: -0.10 vs. Penix) - Legitimate mobility issues indicated by very low scramble rate, time to throw, and low aDOT. Likely needs team-based solutions to pressure to show his prior form.
Spencer Rattler (-0.07; difference: -0.09 vs. Shough) - Low end starter-level success rate on a middling aDOT, but nothing really standing out as a red flag in his stats.
Davis Mills (-0.10; difference: -0.23 vs. Stroud) - Almost significantly worse than Stroud statistically, with low completion percentage and CPOE as concerns. Led league in aggressiveness and fastest time to throw behind the 5th best pass blocking efficiency unit per PFF implies a quick trigger out of preference or play design rather than explicit need.
Russell Wilson (-0.16; difference: -0.23 vs. Dart) - Not technically statistically distinguishable from Dart because of smallish sample, but low EPA via very low completion rate against an estimated easiest defensive opposition faced among our qualifying QBs inspires little confidence.
Jake Browning (-0.26; difference: -0.44 vs. Burrow) - 2nd highest interception rate on the list on limited snaps, but did have difficult opponents (2nd hardest on the list).
Cooper Rush (-0.36; difference: -0.46 vs. Jackson) - Positives: 3rd highest completion rate and faced the 2nd toughest opposition. Negatives: Poor EPA via highest listed interception rate; zero rushes/scrambles imply limited escape ability, despite the name.
Tier 6: Avert Your Eyes
(< 25th Percentile of Presumed Starters, Demonstrably Worse than Starter)
Whatever tools and talents these players possessed didn’t show up much in game performance, so they might better be considered for long-term developmental or mentorship purposes, but are not in discussion for day 1 starter.
Jake Browning
Chris Oladokun
Trey Lance
Kenny Pickett
Max Brosmer
Brady Cook
Additional Notes
Visualizing QB EPA for teammates side-by-side has provided a kind of situational context for the numbers these quarterbacks are posting. It has shown us why some of the usual suspects (e.g. Malik Willis, Mac Jones) are being considered for starting jobs, but has also highlighted some interesting options that haven’t gotten any buzz at all (e.g. Jameis Winston, Tyler Huntley).
Still, there are a few things readers should keep in mind. First, as with many metrics, it is difficult to attribute high ratings to individual players. Its play outcome focus means that a QB might get credit for a long play broken by a wide receiver, even if the throw was a simple wide open one behind the line of scrimmage. That’s why it is quite valuable to look at multiple metrics to get the fuller picture, and to look over more than just one season, in case injuries or other factors have been an issue.
While the visualization does make direct comparisons between teammates, there are events, like the opponent, weather, or injuries at receiver or offensive line, that would affect teammates disproportionately and make those comparisons less fair. Also, given that backup appearances can often be in relief and without the benefit of practice time with the first team in the days leading up, one might expect backups to perform better with typical preparation. Of course, it could work the other way, where a backup would have more of an element of surprise against opposing defenses. These types of circumstances are worth keeping an eye out for when doing a deeper dive.
Also, quarterbacks with really low snap counts might have the advantage of not having much on tape, depending on how long they’ve been in the league. As their shortcomings become more obvious and defenses adjust, their performances may regress.
But overall, I think the process has generated a couple useful visual aids to help screen a good portion of potential candidates and, combined with other tools and information, guide teams towards a more informed decision on something that will have large and long-lasting consequences. For everyone else (e.g the fans), these visuals can at least offer a bit of ammunition for lively debates.