
Over the past few months, I’ve seen a fair amount of discussion regarding the possible effect of cuts to Medicare and Medicaid to be enacted as part of the OBBB signed on July 4, 2025. Some of this discussion (JHSPH, AMA) has focused on the decreased funds available for delivering care in rural areas, leading to decreased service in these areas.
Access to primary care is considered key for delivering preventative care to detect disease early, manage chronic disease, and serve as a trustworthy resource for those trying to maintain their wellness. It serves as one of the main lines of defense against serious illness and death. Given that, the anticipated consequence of any measures that lessen access would be clearly increased mortality and morbidity, especially in areas that are already medically underserved.
For this project, I’ll work to visualize how one component of community access to primary care, primary care provider density, relates to the rate of preventable hospitalizations, a marker of community health quality. I’ll also visually characterize how that access metric correlates with a two other demographic characteristics (e.g. rurality and economic prosperity) that may affect the provider density-preventable hosptailziation relationship..
This project was initially intended as just a coding exercise to create the combined map/ranking/scatterplot chart and apply other visualization methods in R/Quarto. While I couldn’t help but include some multistate correlation analyses given having the data, I would refer to papers that do a bit more adjustment for other variables and/or use individual measures (like ones mentioned in Discussion at the end) to more confidently characterize how preventable hospitalizations relate to the patient demographics given the importance of the topic.
Aim
Illustrate the relationships between county-level primary care provider density and:
county ruralness
county socioeconomic status
Data & Methods
Just a quick data introduction:
The county-level figures are sourced from datasets compiled by the University of Wisconsin Population Health Institute and delivered through their County Health Rankings & Roadmaps website. The specific measures include:
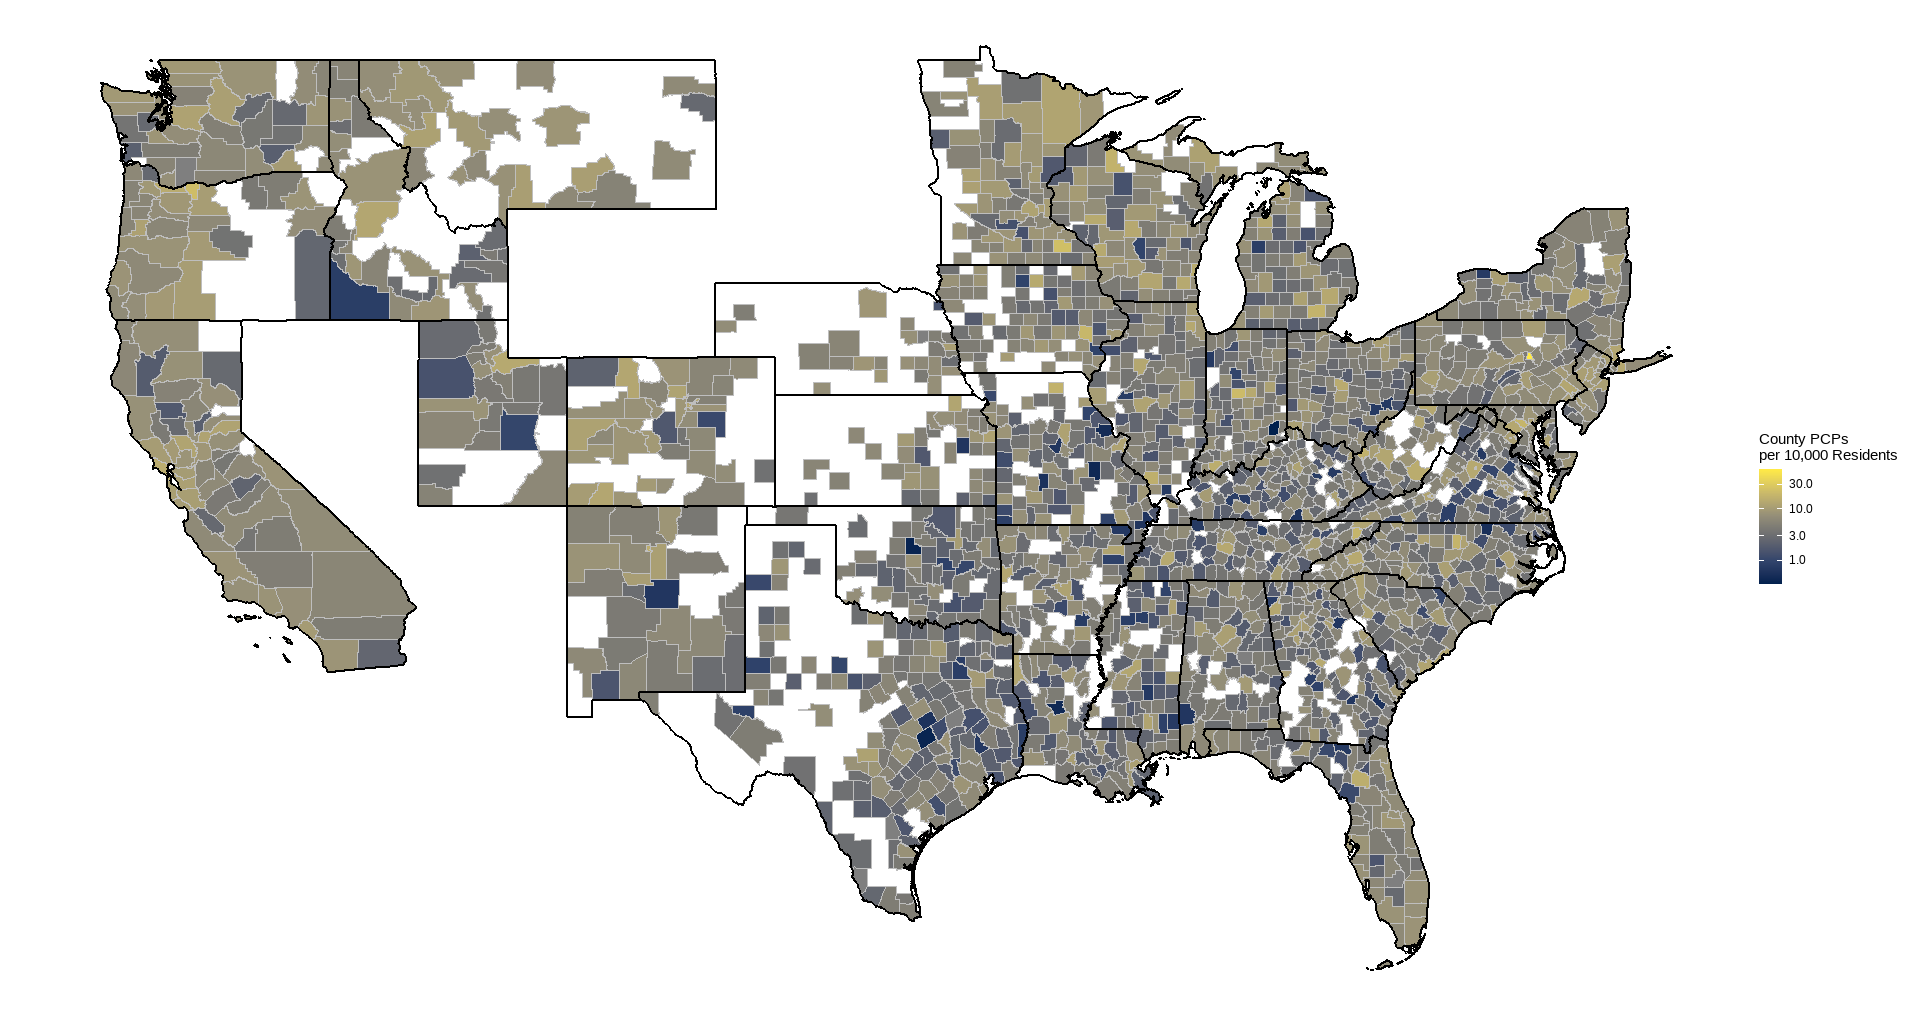
- Primary care provider density (providers per 10,000 residents), 2021
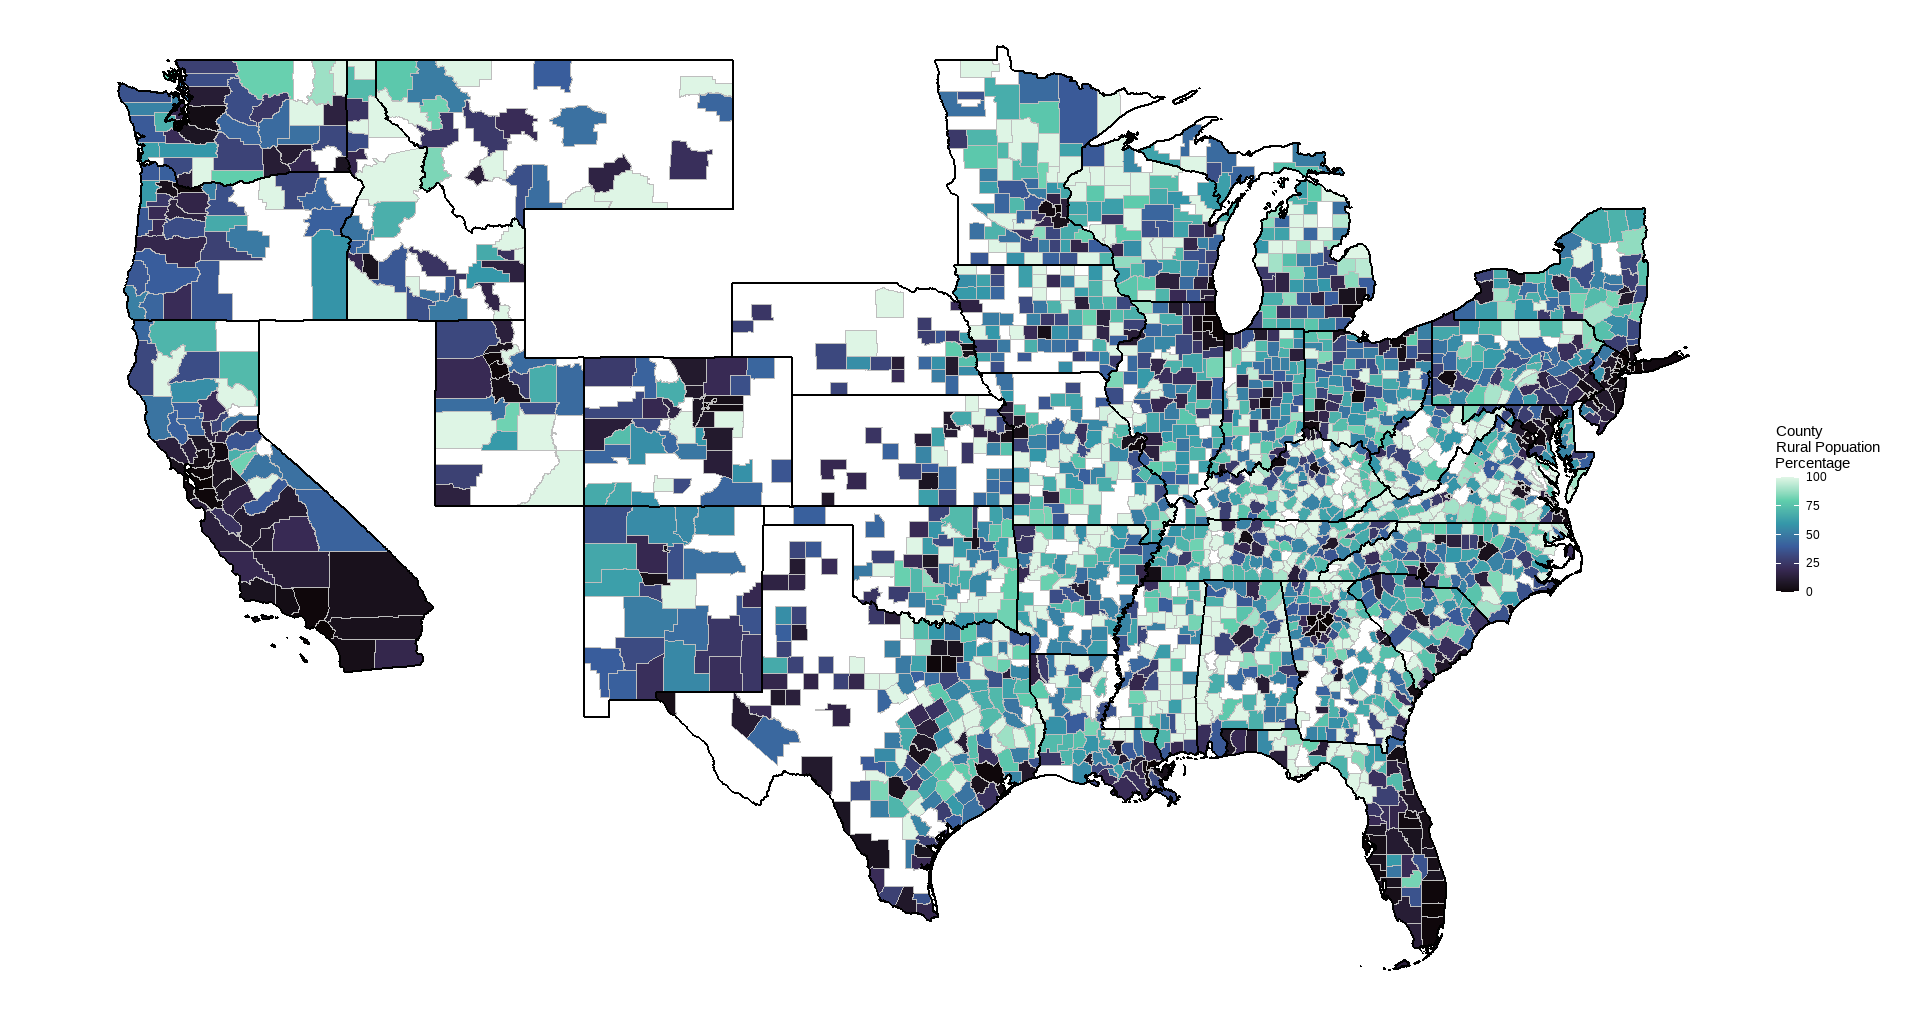
- % Rural residents, 2020
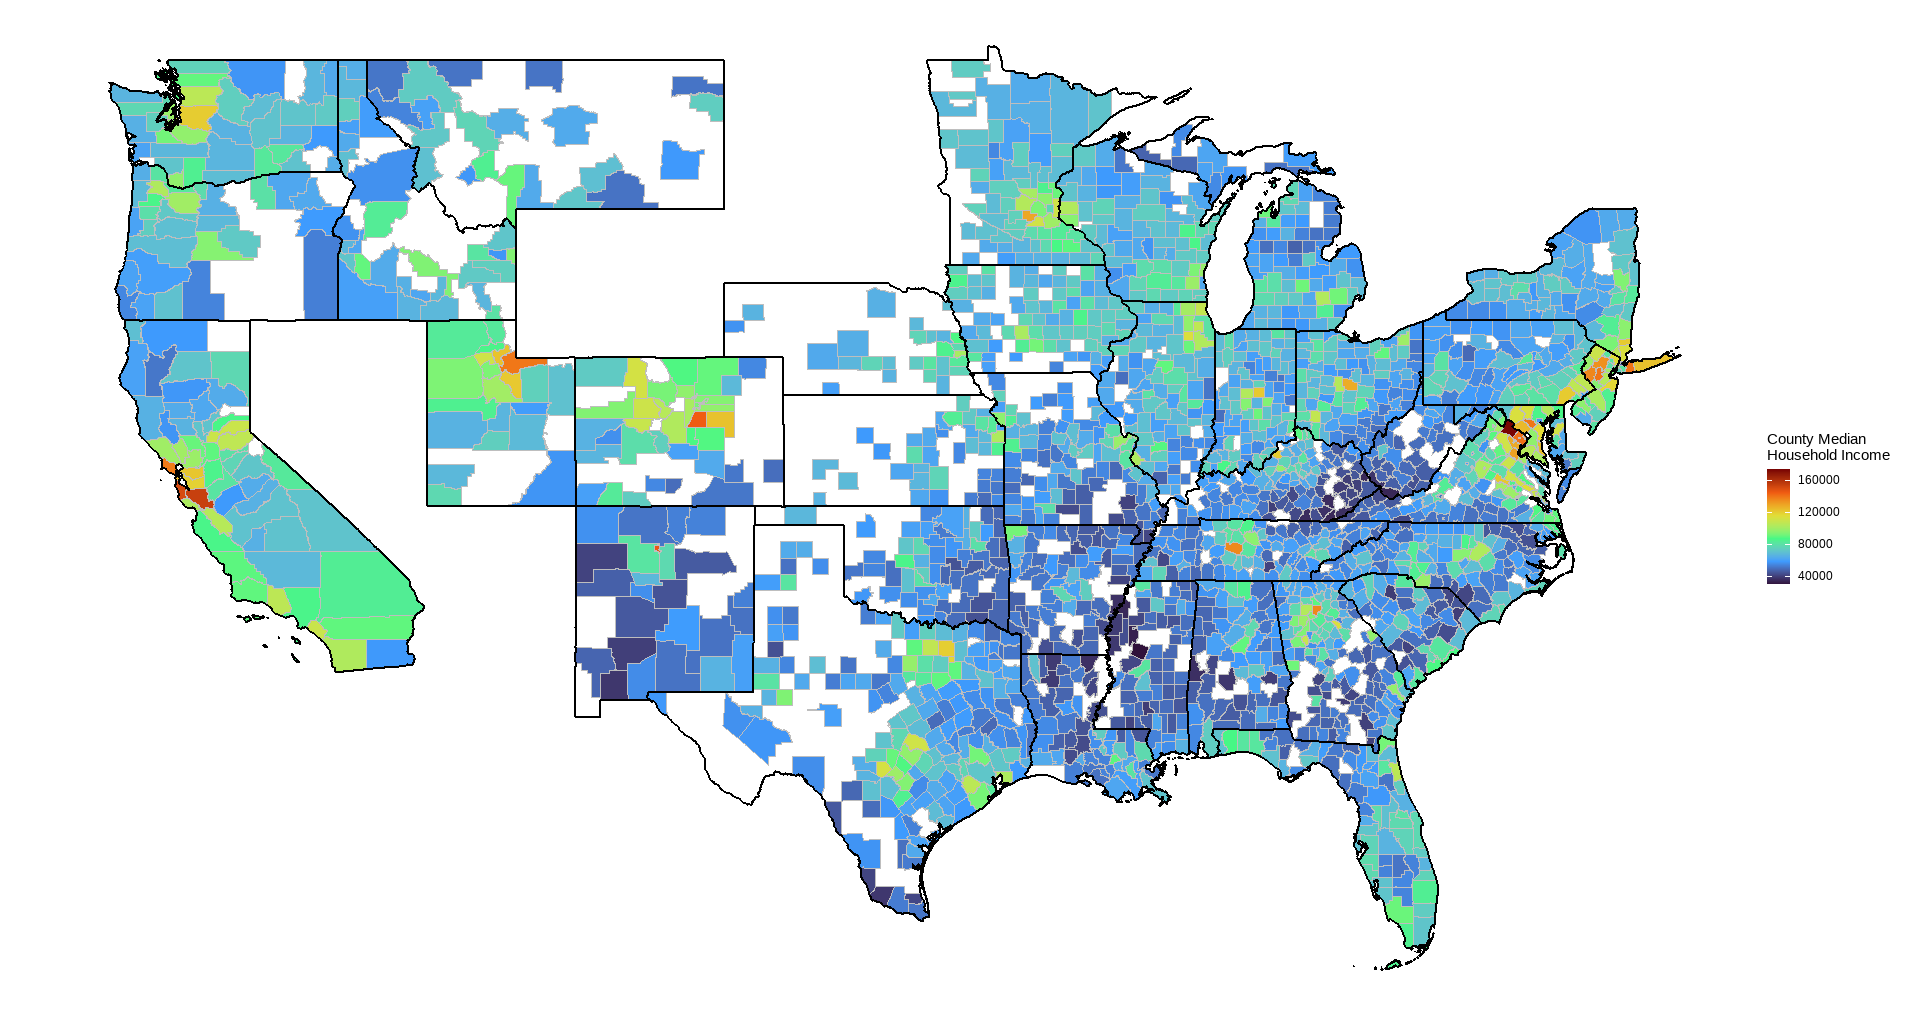
- Median household income, 2019-2023 or 2023
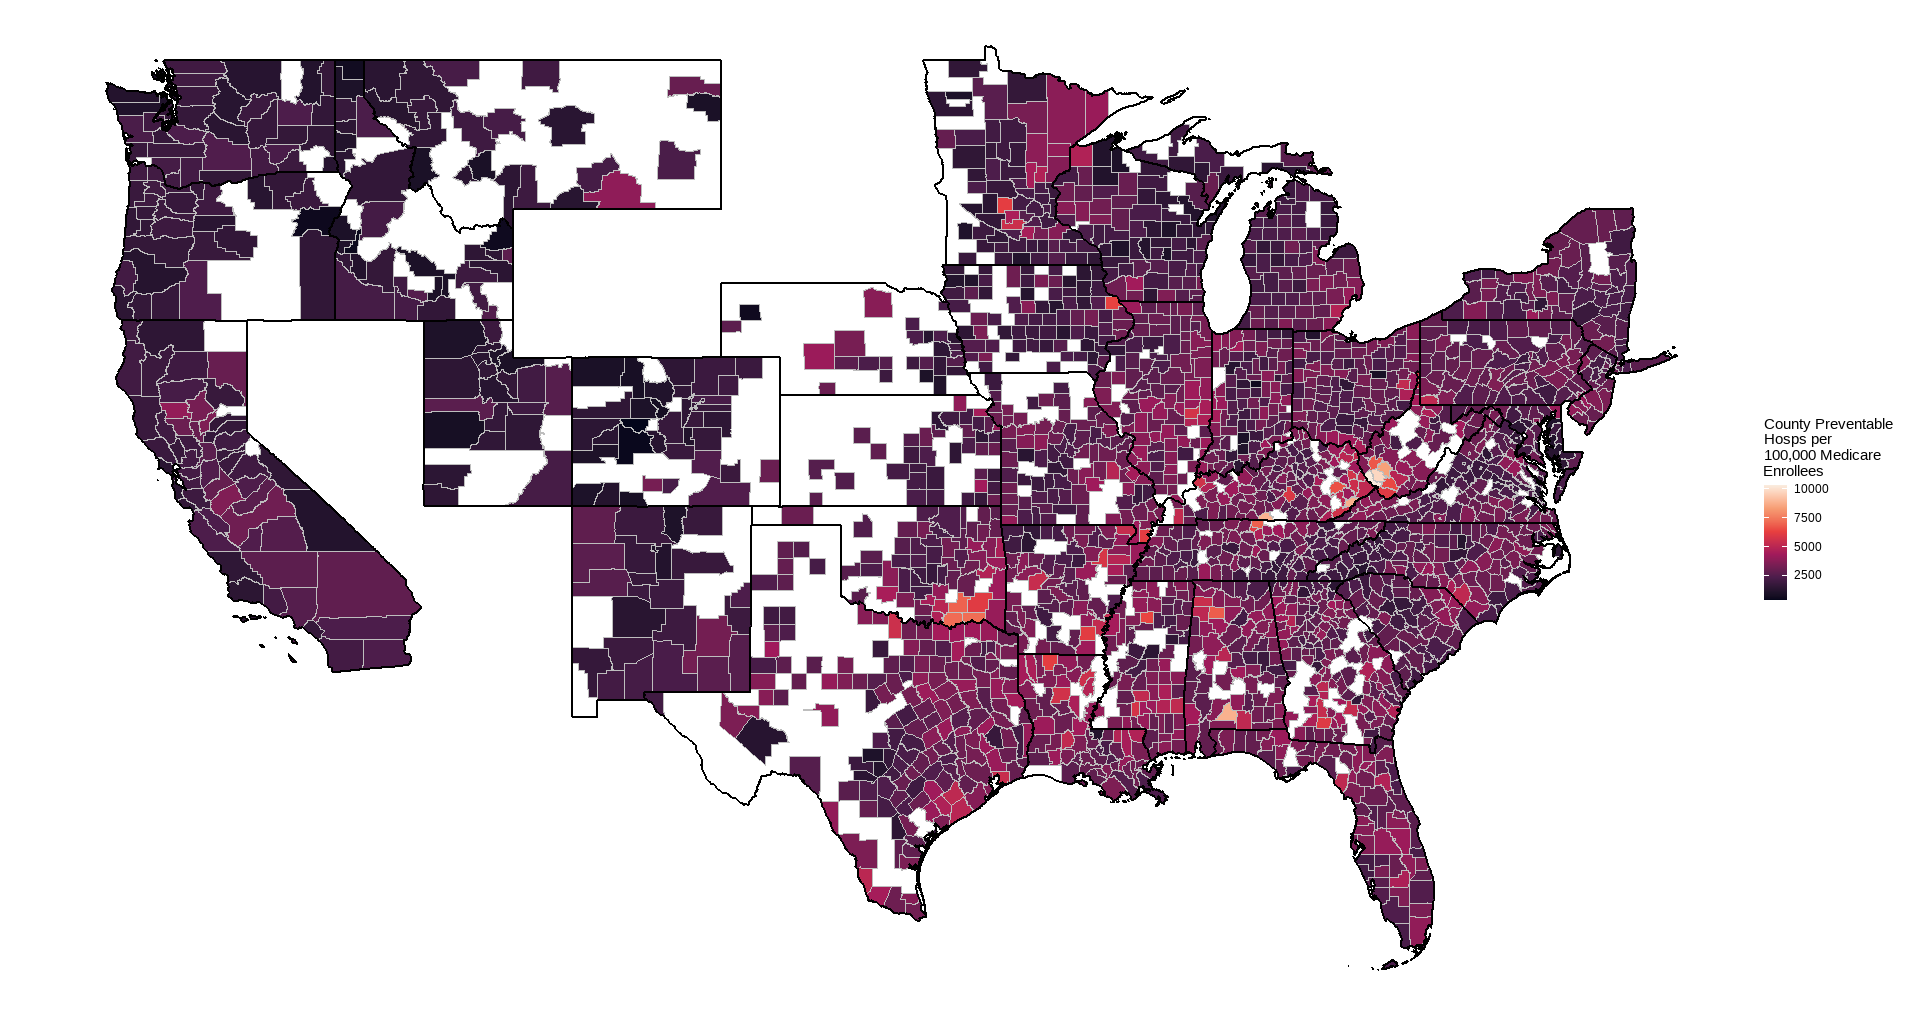
- Preventable hospitalizations for Medicare enrollees (visits per 100,000 Medicare enrollees), 2022
Rural residents are defined by the census to be person not living in an urban area (areas with minimum 2,000 housing units or a population of at least 5,000). Preventable hospitalizations are an estimate of hospital stays that could have been treated in outpatient settings (e.g. bacterial pneumonia, congestive heart failure). This should be a fairly direct indicator of lack of access to primary care. They are likely to be costly to both the individual (via medical costs, lost time for work/activities, and quality of life) and to society (via medical expenses incurred through Medicare/Medicaid, lost productivity).
County maps are TIGER/LINE shapefile files provided by the U.S. Census Bureau and accessed through the R tigris library.
Correlations reported in the graphs are Pearson correlations weighted by county population using the psych package, aggregated by state to mitigate possible differences related to state-level policies and other areal characteristics.
Results
With our criteria of requiring a minimum of 20 counties for a state, 36 states remained for analysis, ranging from 21 to 159 counties (median = 61).
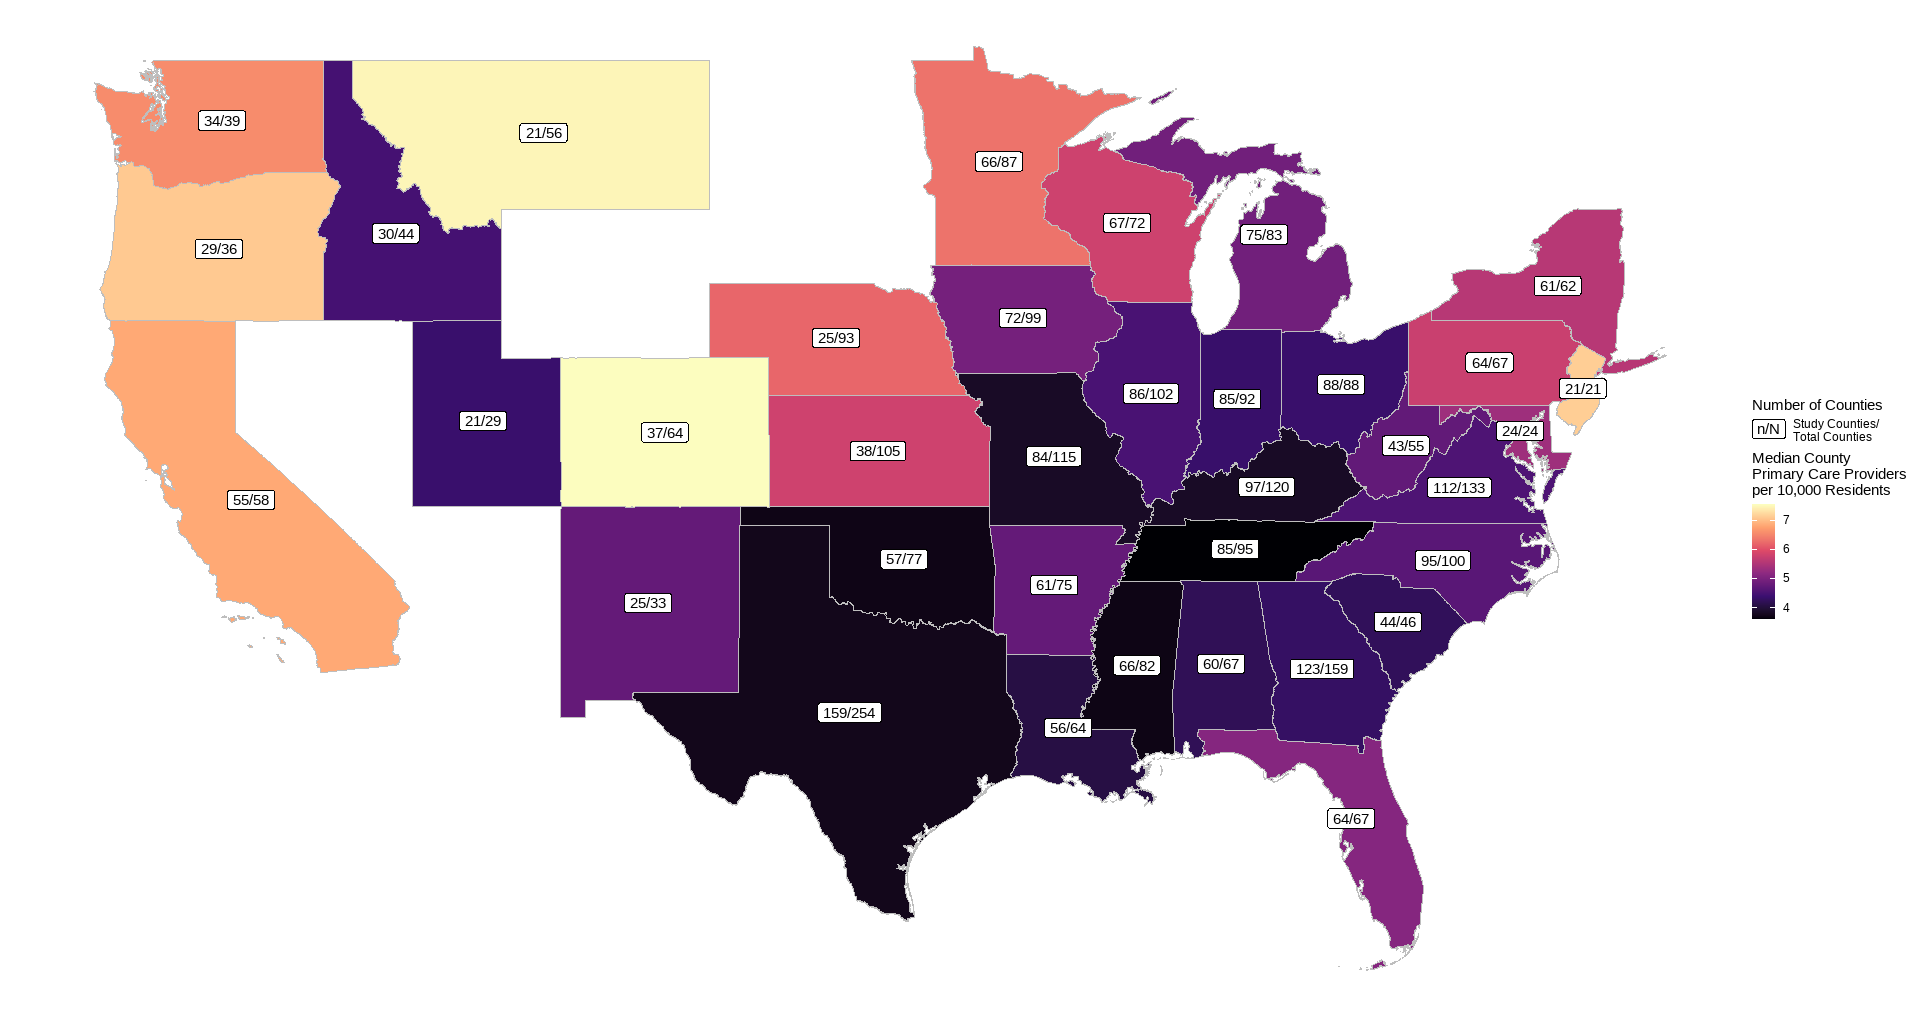
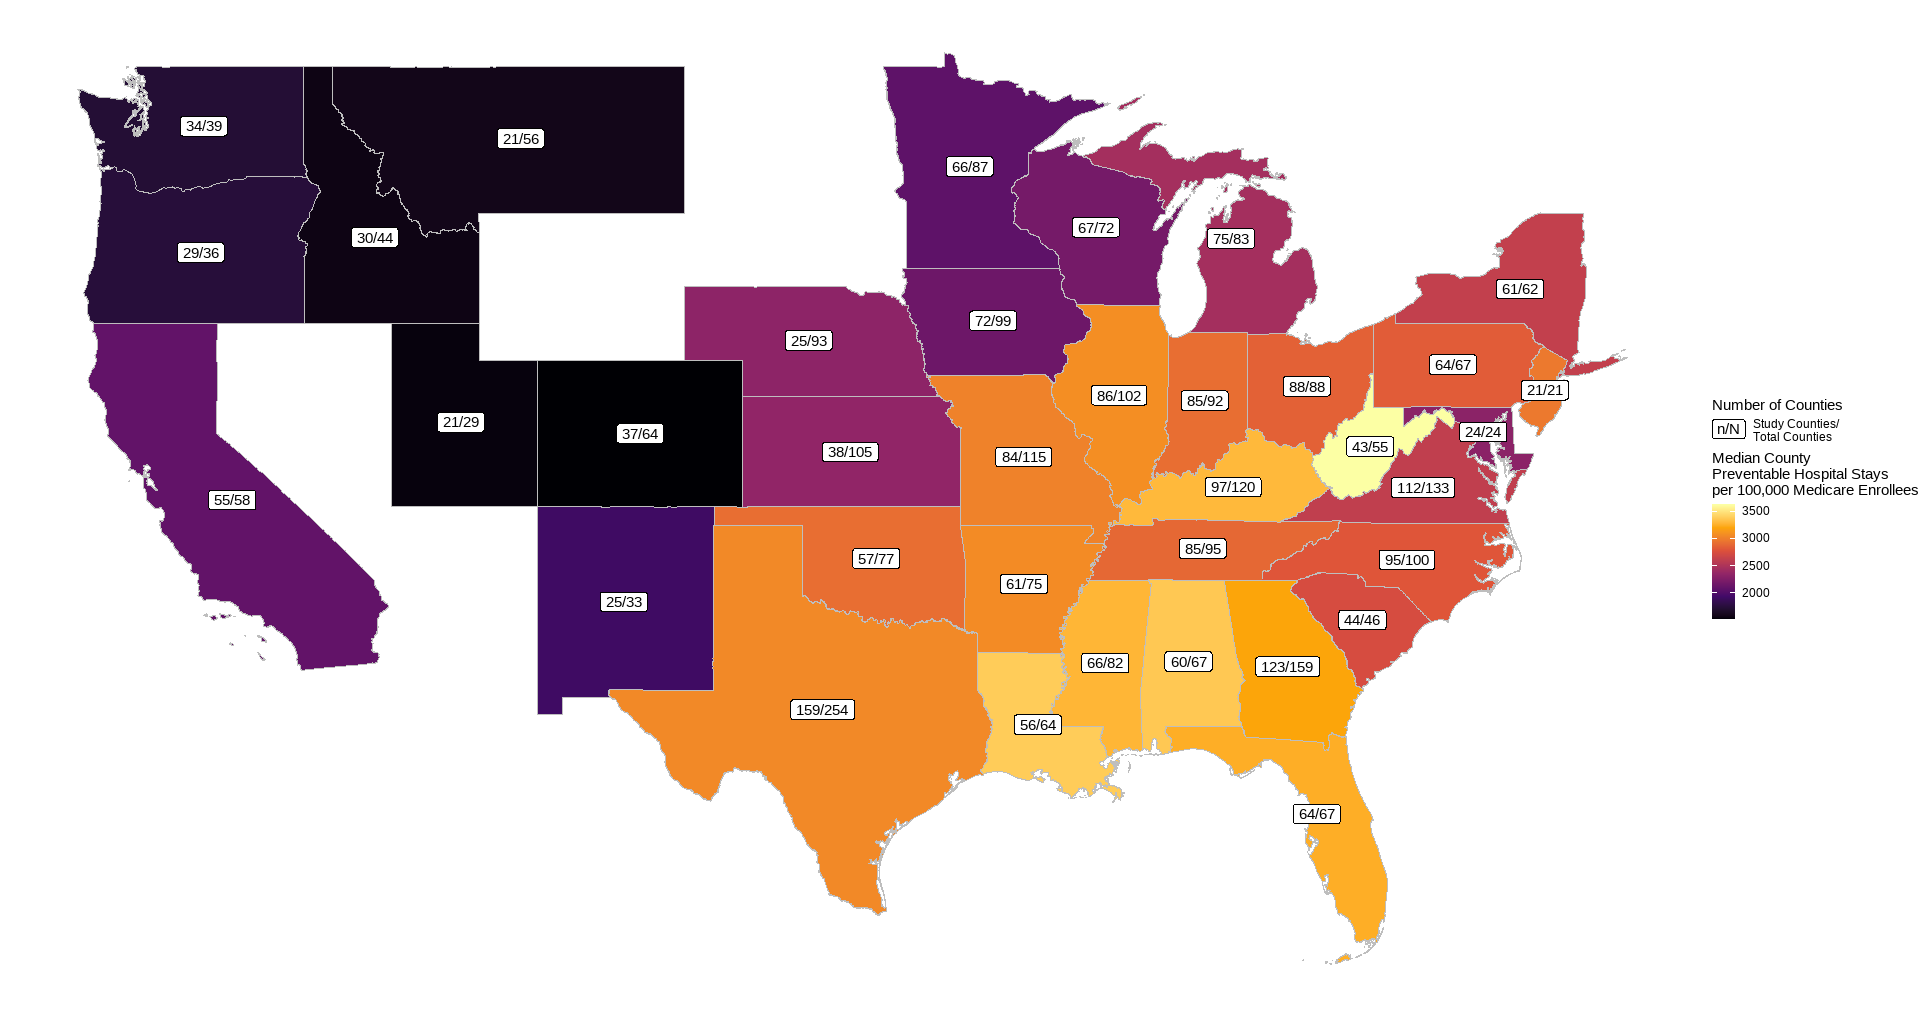
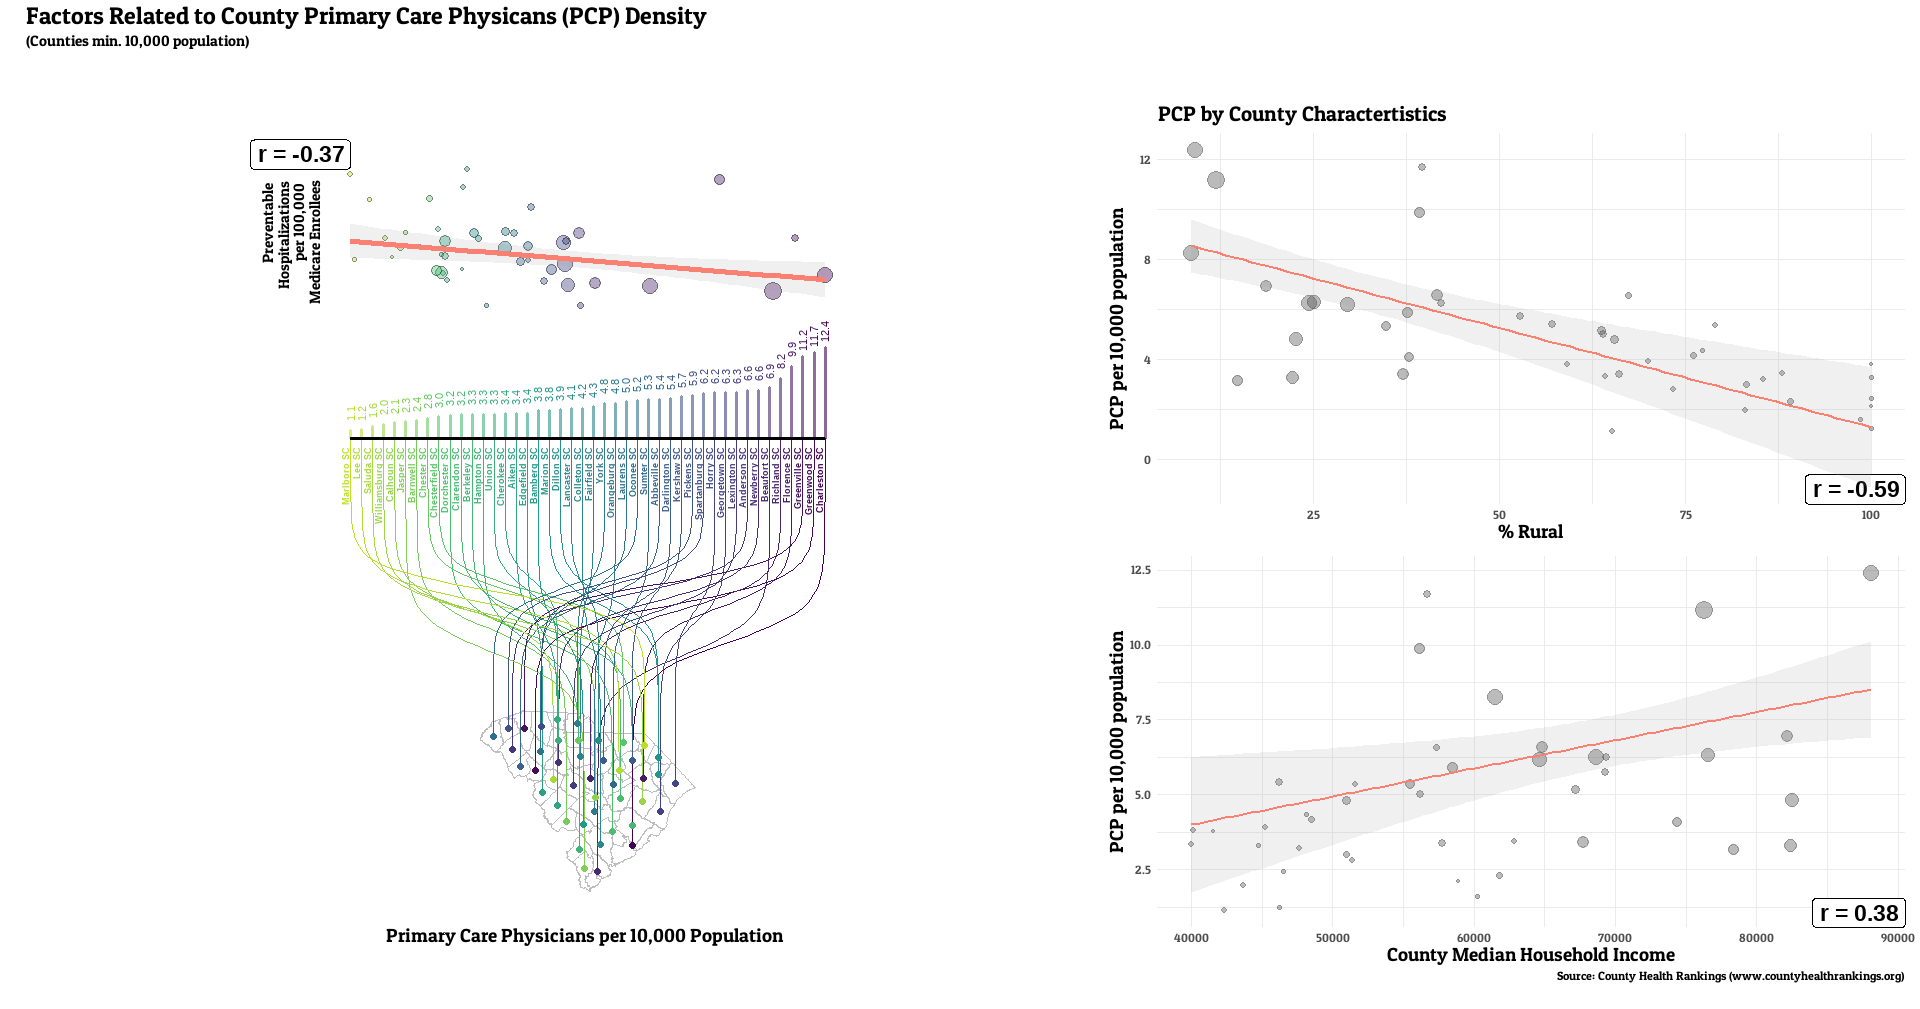
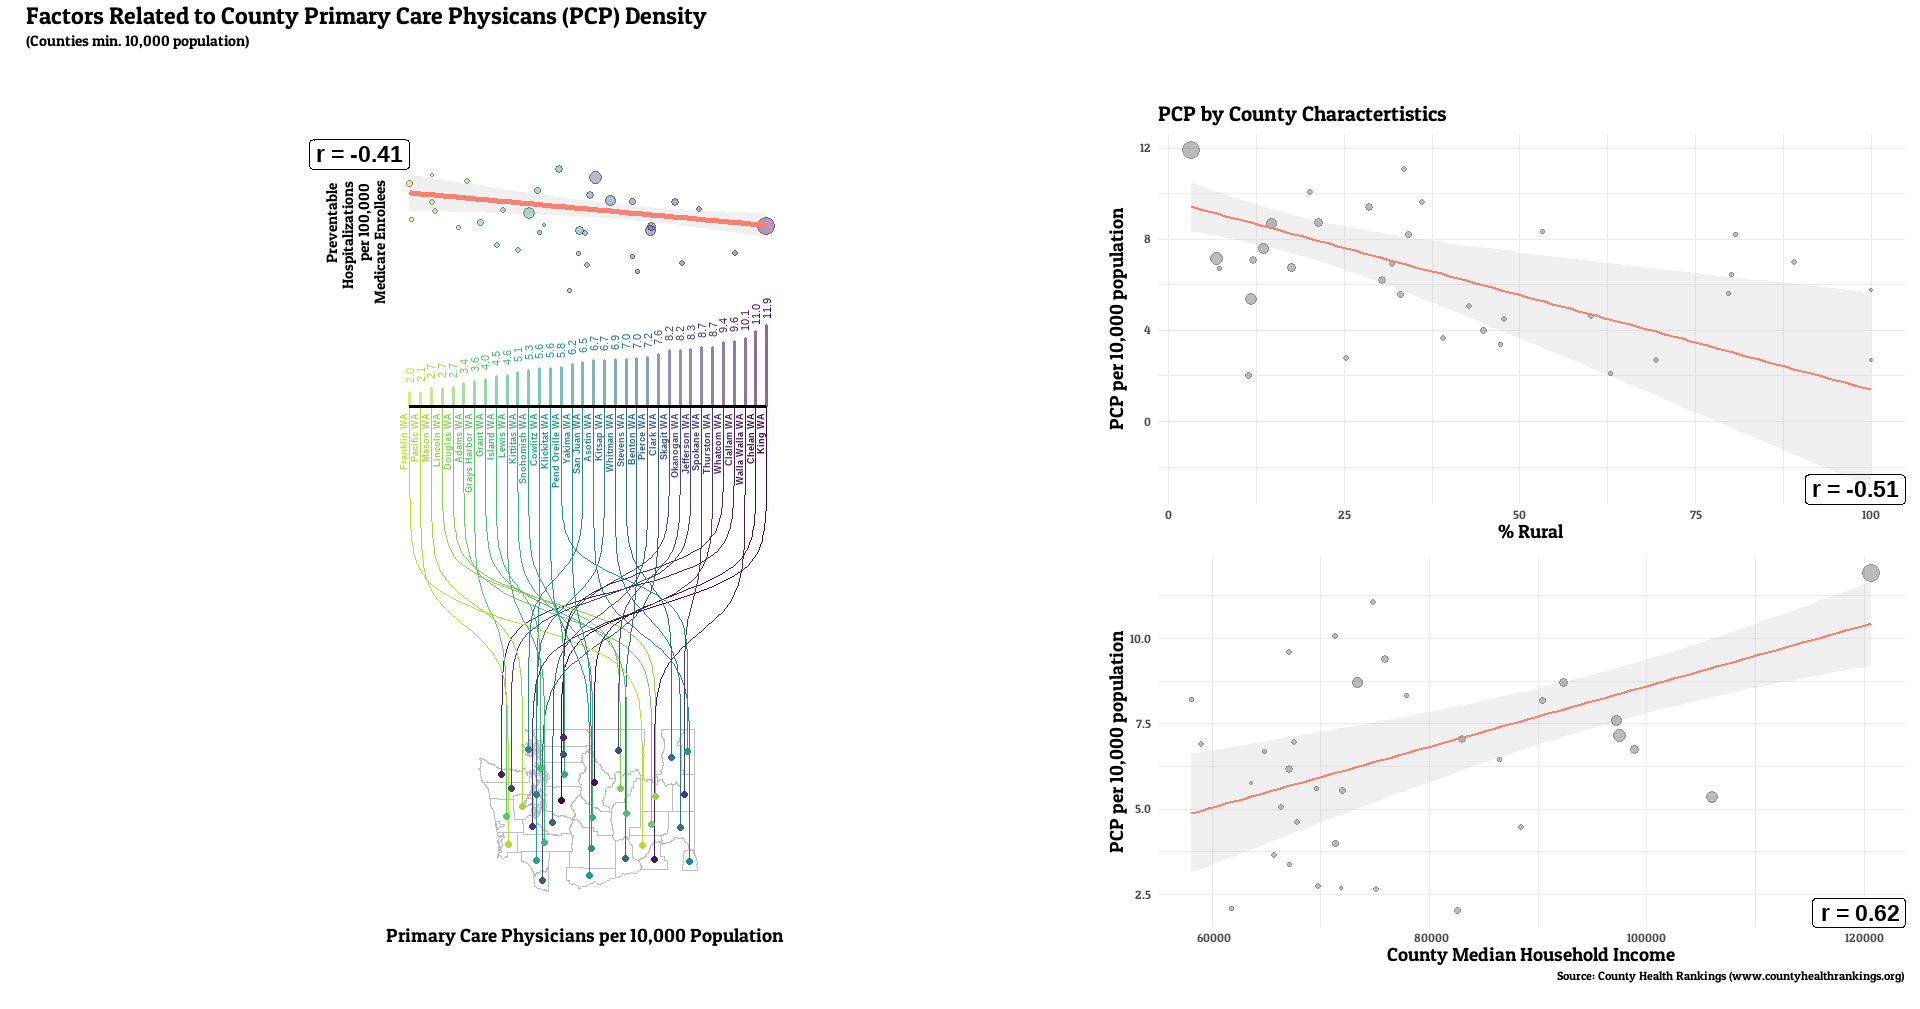
Tables. County Median Values for Predictor and Outcome of Interest for Each State
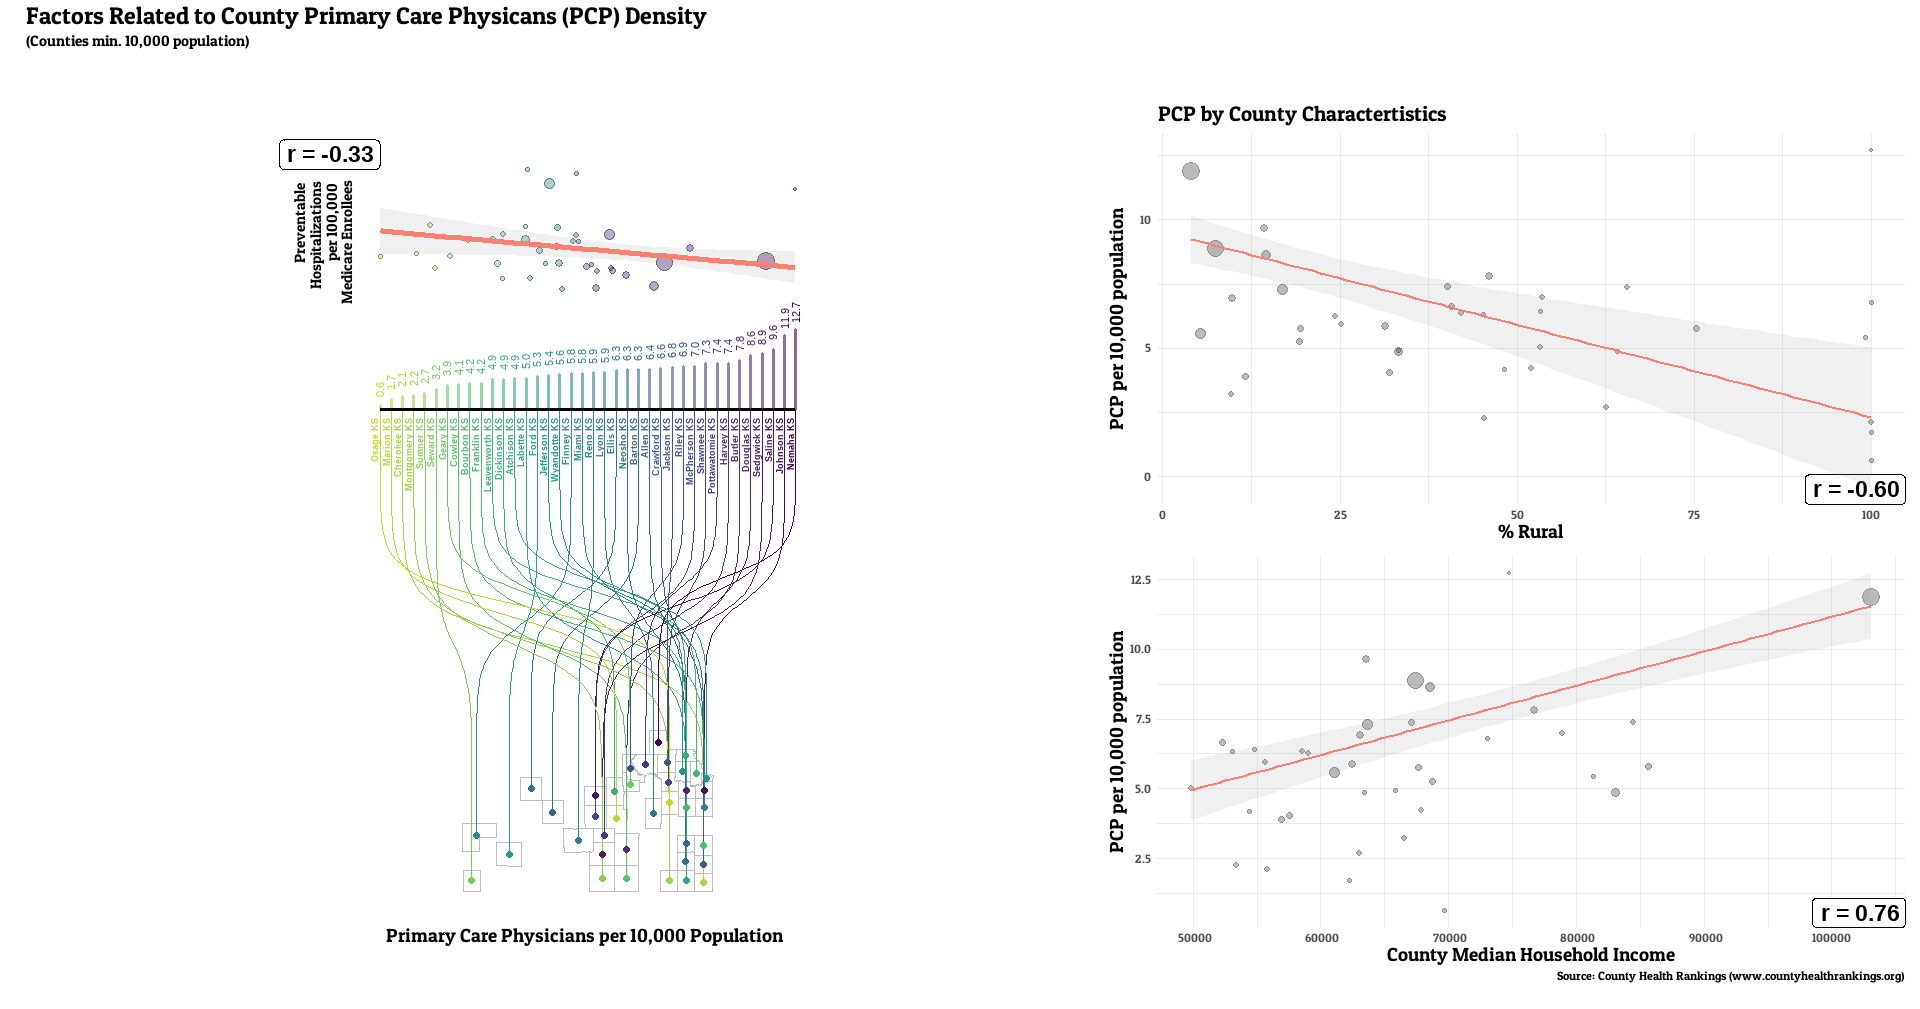
Full county-level maps for all the metrics are provided by County Health Rankings. For this analysis, the state with the highest median PCP density was Colorado (7.6 per 10,000 residents), with the lowest being Tennessee (3.6). Preventable hospitalization rates were lowest for Colorado (1527 per 100,000 Medicare enrollees), while WV had the highest median (3634).
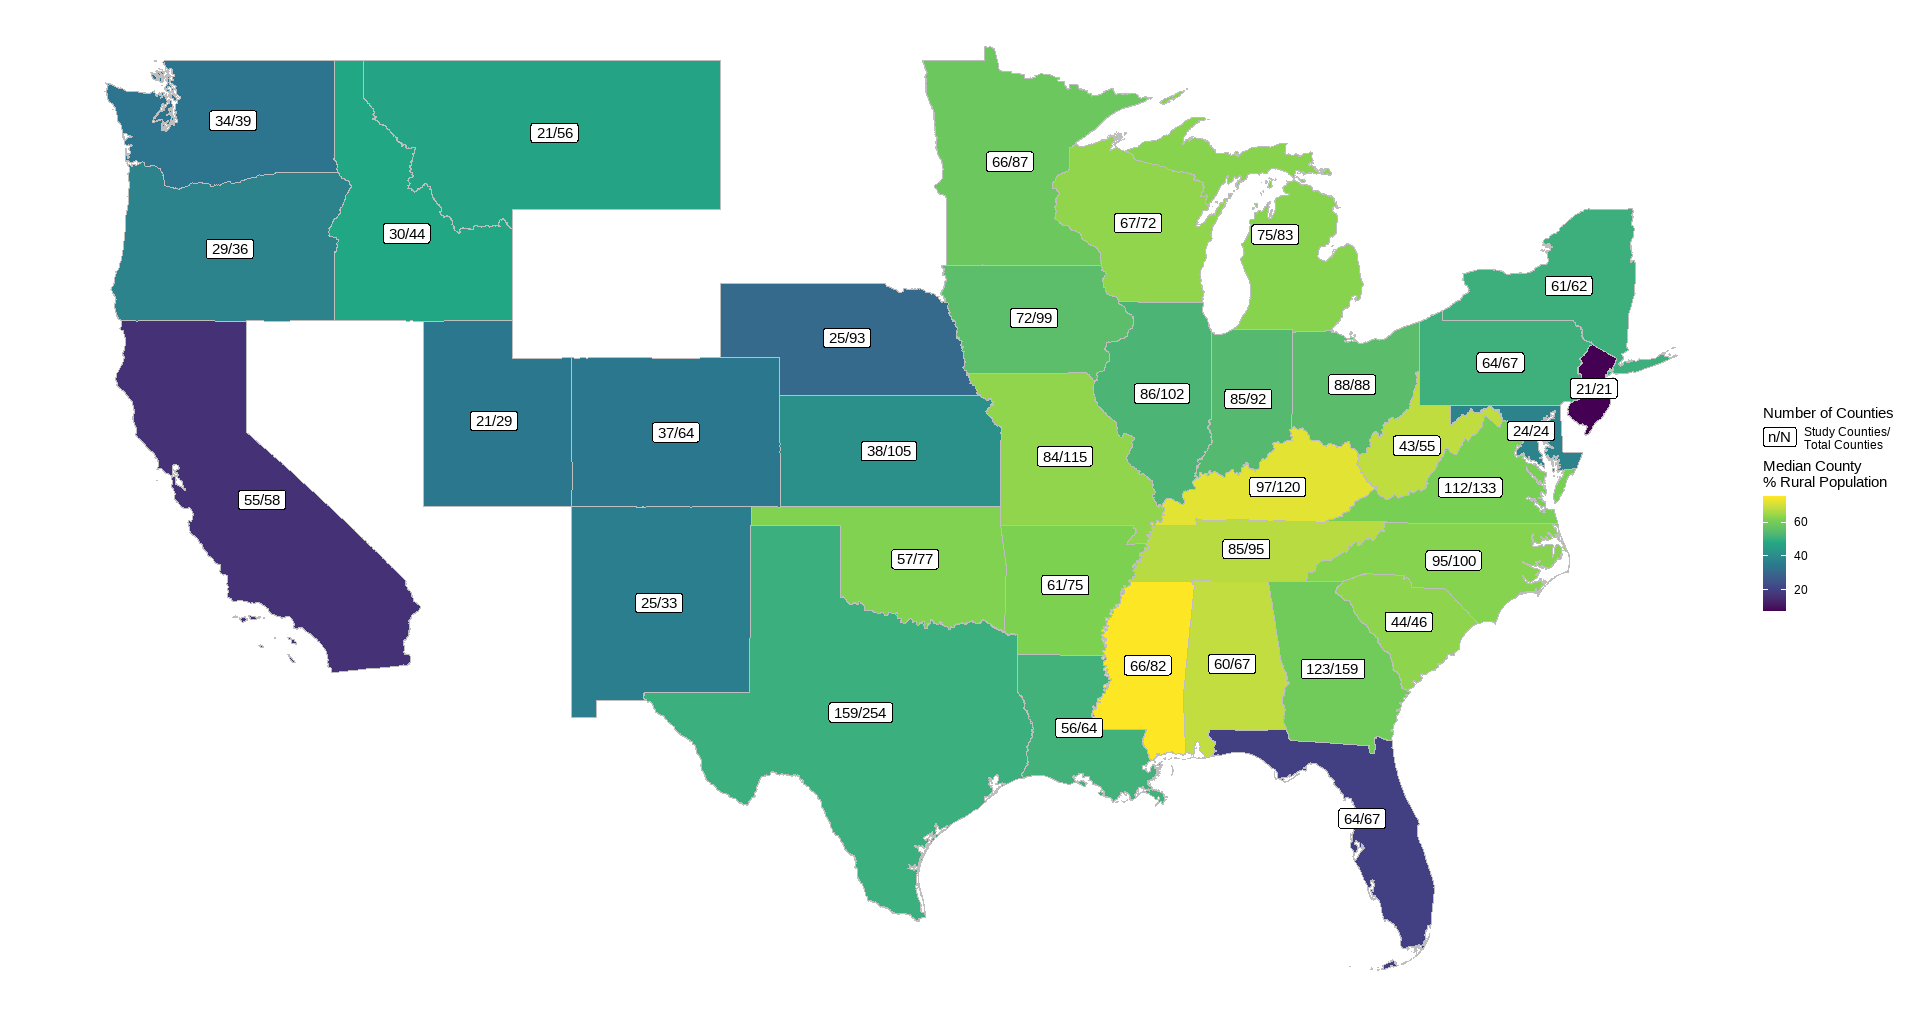
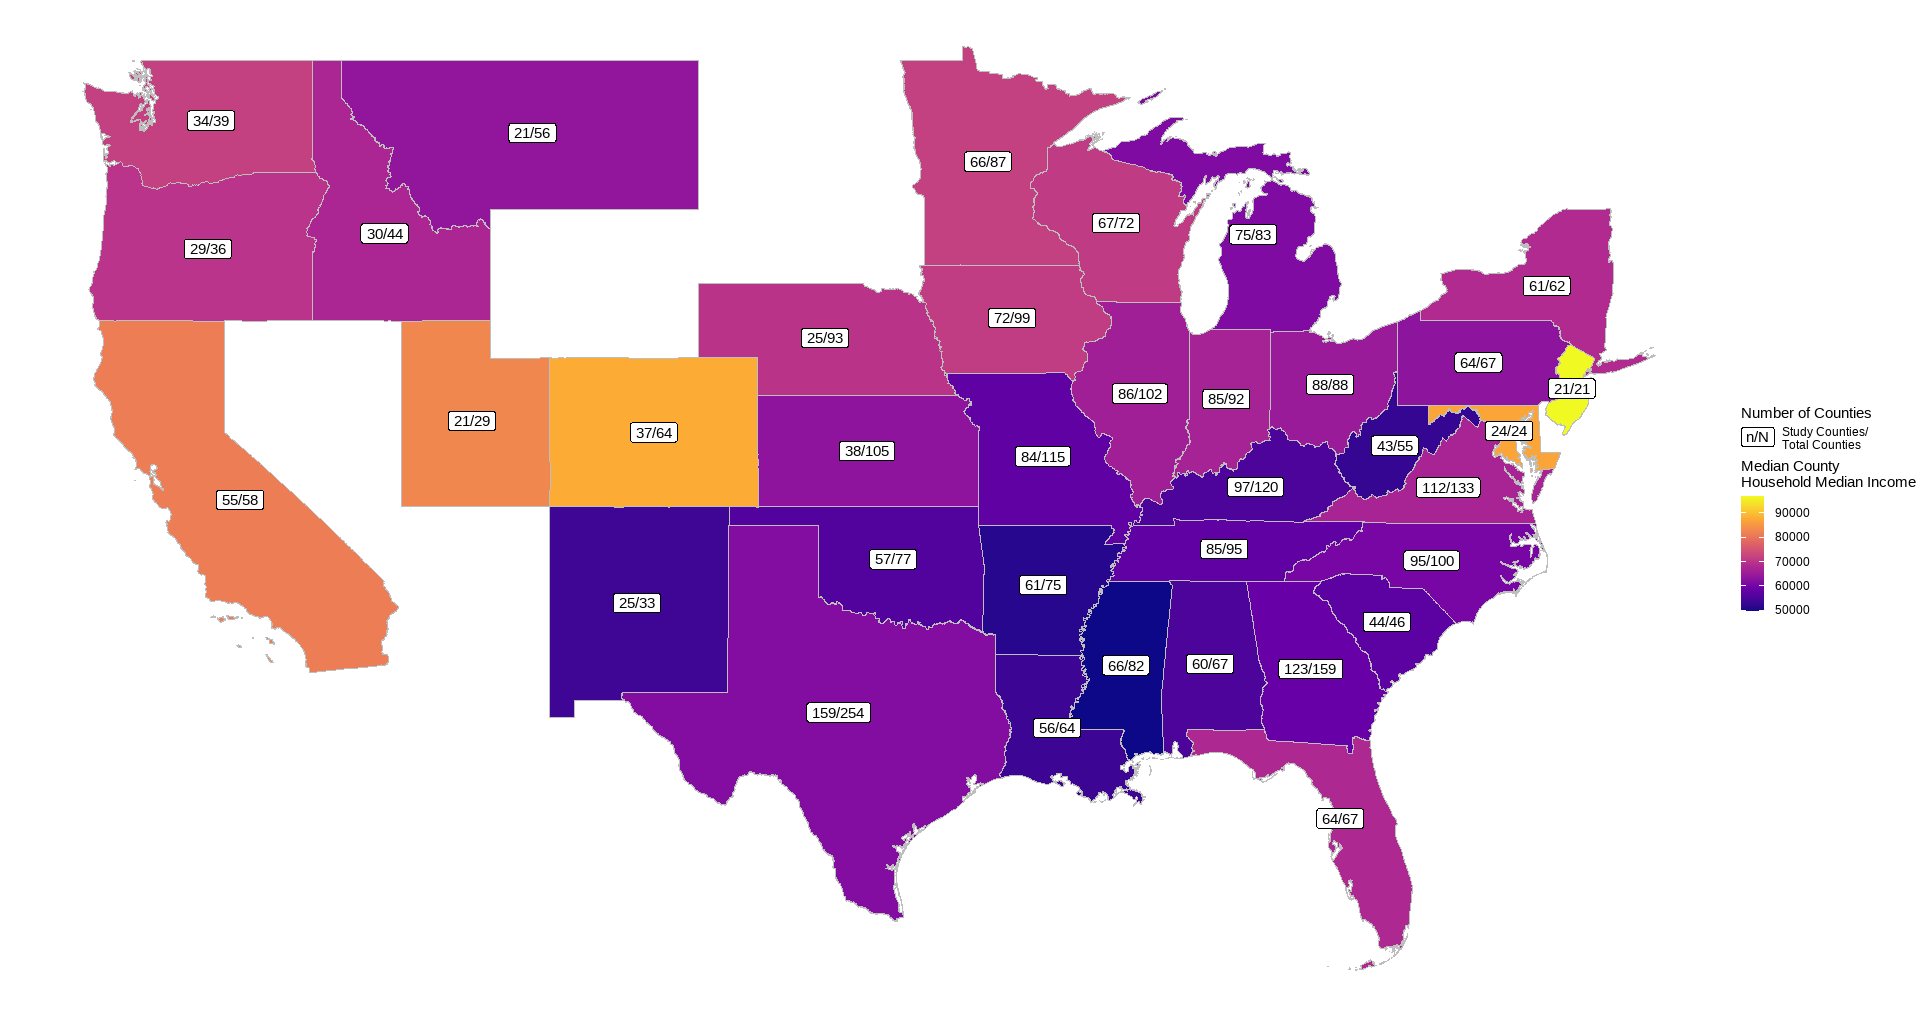
Tables. County Median Values for Related Factors for EAch State
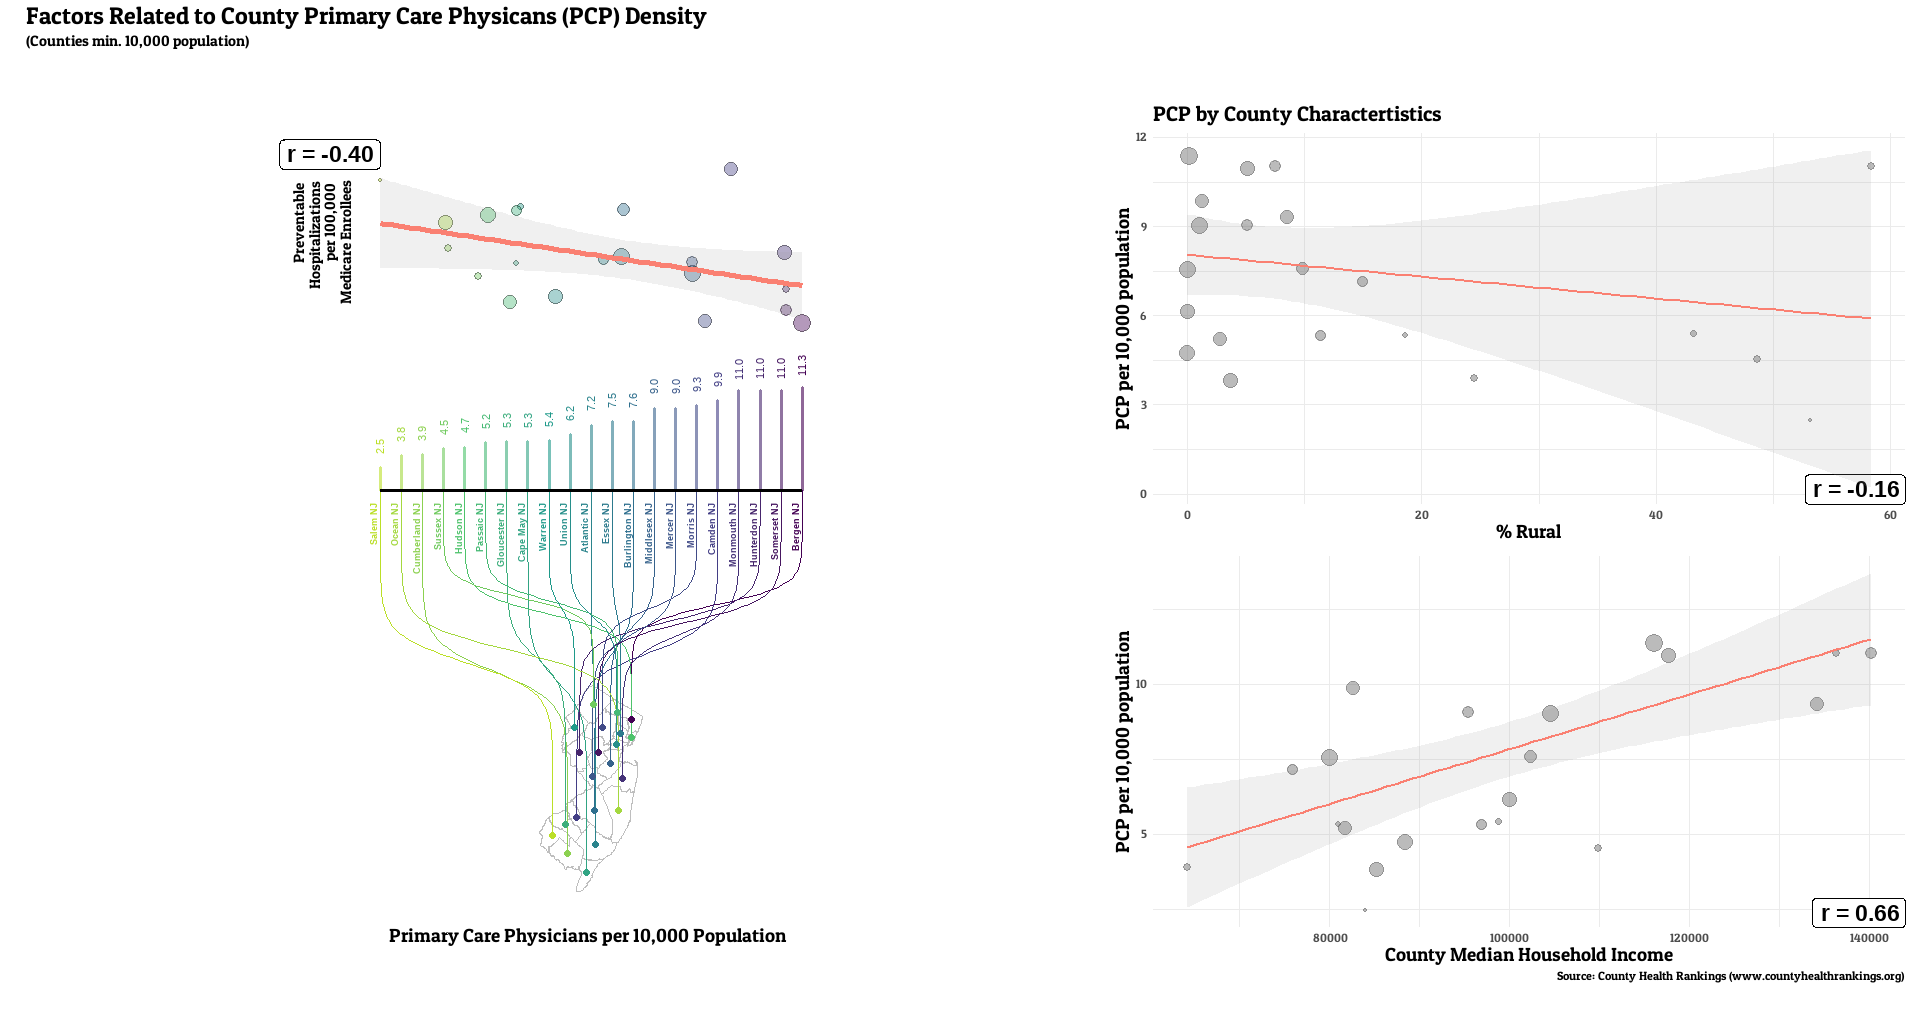
The state characterized as most rural in this analysis was Mississippi (median county rural residents = 76%), with New Jersey characterized as the least rural (median county = 8%). State with lowest median income was also Mississippi (county median = 49869), with the highest being New Jersey (county median = 96965).
Tables. Statistical Significance and Effect Size Tests for Division-Level Ranking Patterns
Table. Statistical Significance Tests for Differences between Teams Within Divisions
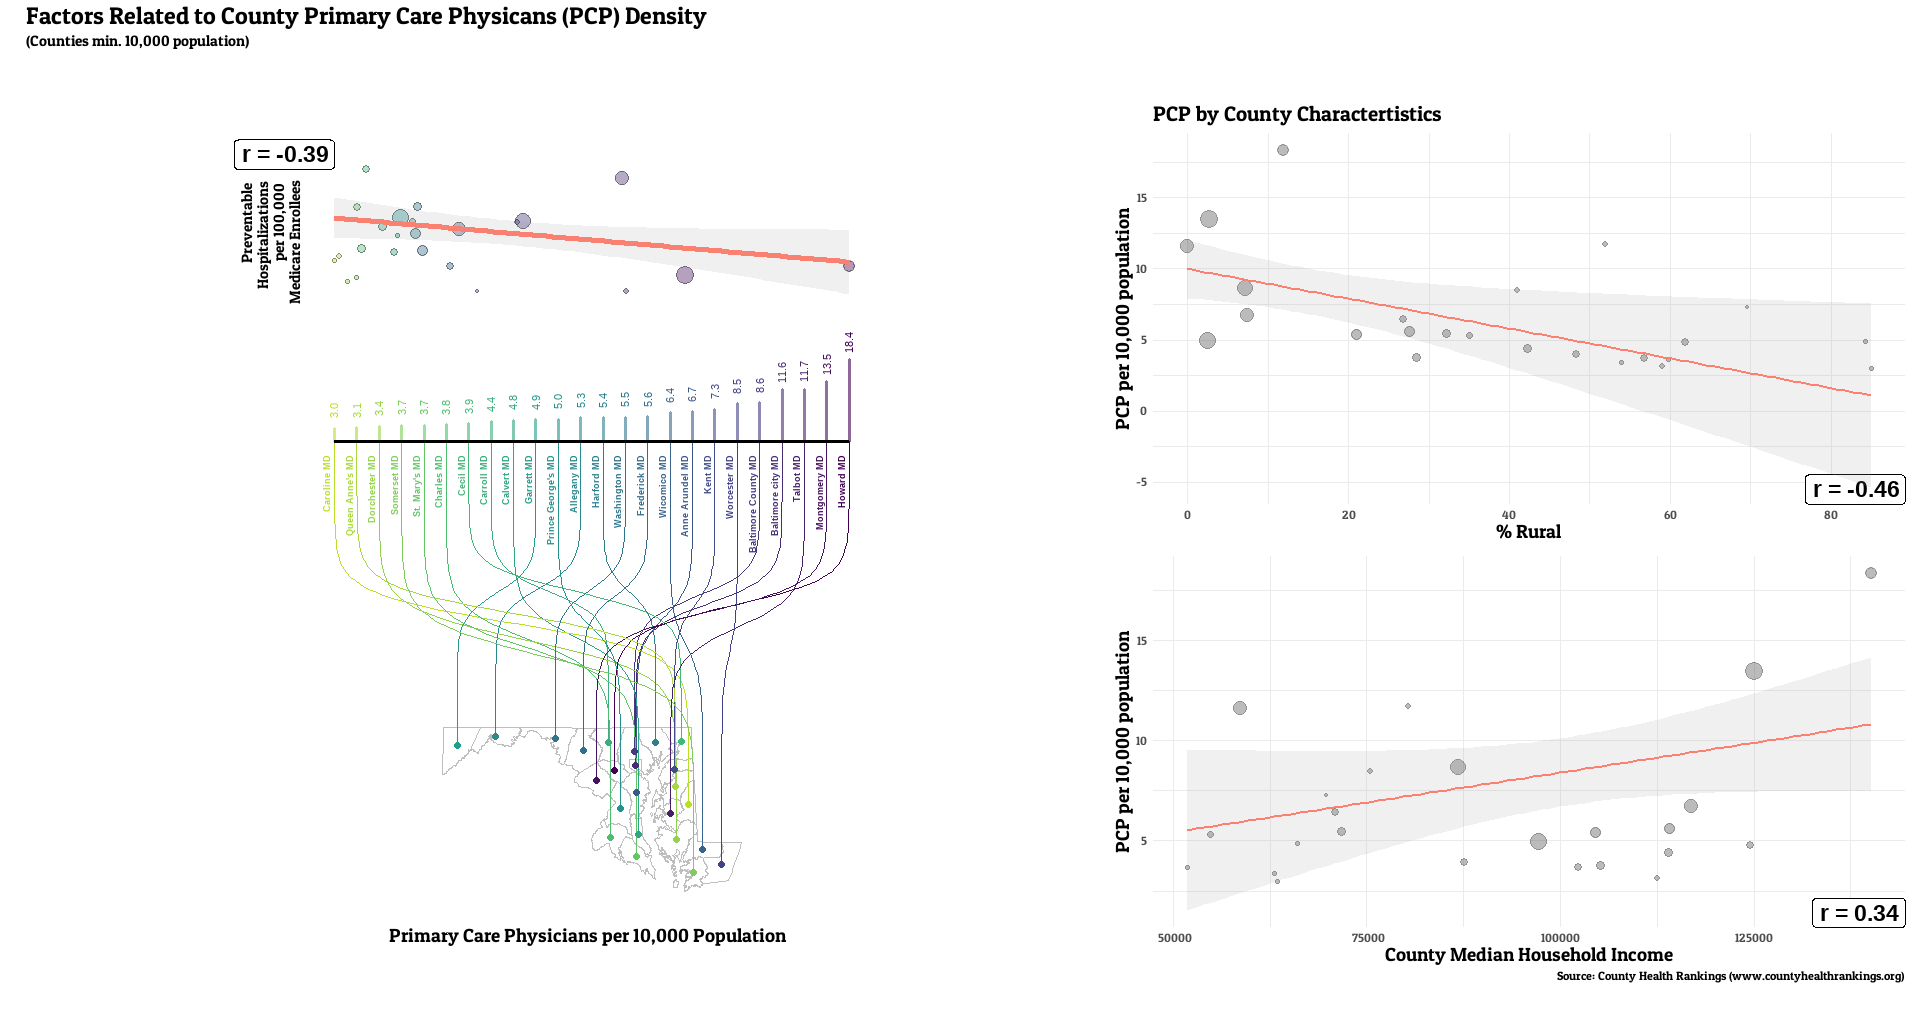
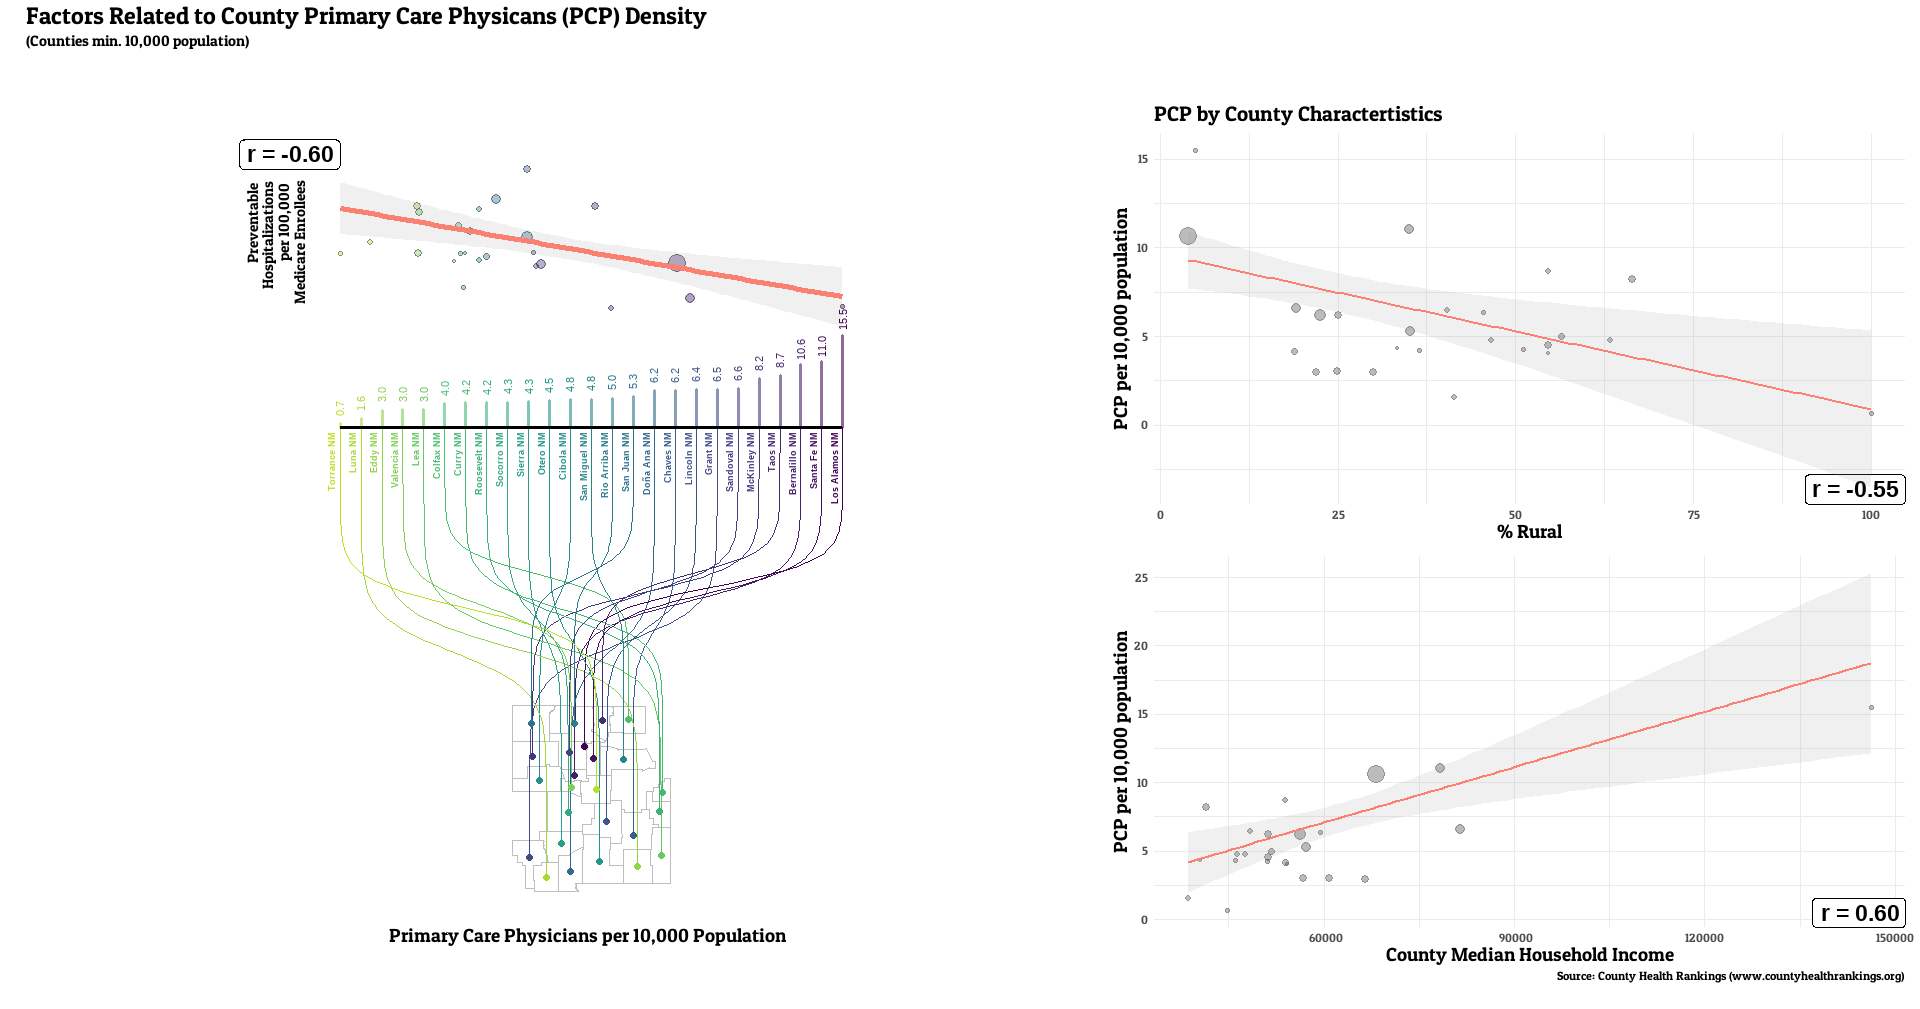
The number of primary care providers in a county was generally correlated with lower rates of a county’s preventable hospital stays (median r = -0.20, range: -0.61, 0.29, r < 0 for 32 of 36 states). Lower PCP density was linked with the higher rural resident percentage for all states examined (median r = -0.55, range: -0.80, -0.15, r < 0 for 36 of 36 states). weaker, but still generally positive correlations between PCP and median income (median r = 0.25, range: -0.17, 0.76, r > 0 for 31 of 36 states).
Discussion
We did see a fairly consistent relationship looking at higher primary care physician density and lower rates of preventable hospitalizations, which is what we would hope to see if preventative care really was effective in forestalling serious health issues. This is despite looking only at Medicare enrollees, who have all have some level of health insurance, which helps adjust for access to care to some degree. That relationship didn’t appear to be as strong in magnitude to the other county characteristics examined, proportion of rural residents and median household income. These factors have their own relationships with preventable hospitalizations (Johnston et al, 2021, Wallar et al., 2020]), as both lower income and rural populations have more deficiencies around medical insurance and access, higher rates of health-adverse behaviors, and have greater exposures to other unique health stressors (e.g. less access to a healthy variety of foods). The possibility that these factors (or related ones) could act as confounders and theoretically explain some, if not all of the PCP density correlation remains. However, other recent studies using U.S. data saw that relationship endure, even after comprehensive statistical adjustment for other factors. A study of 2011 Medicare enrollee data observed inverse associations between PCP density and preventable hospitalizations, even after adjustment for demographic and socioeconomic factors, health status and insurance coverage, and county-level healthcare infrastructure (Lin et al, 2016). Their additional geographic-weighted regression observed stronger relationships in the South and Northeast U.S. A Virginia study saw geographic access to primary care providers were related to preventable hospitalizations in this Medicare population (Daly et al., 2018). A study of preventable emergency visits in Chicago in the late 00’s/early 10’s observed more of them in medically underserved areas (Fishman et al., 2018). This adds to a previous review of studies across a number of nations which found the number of general practitioners in an area, among other access metrics, to generally be inversely related to preventable visits when socioeconomic factors are accounted for (Rosano et al., 2012).
The barriers to primary care visits created by having less primary doctors close by are fairly intuitive, with the dearth of primary care providers typically conspiring with other factors to reduce the number and quality of visits made by the community (American College of Physicians, AAMC, AMA). Rurality and socioecocnomic deprivation are two of such factors. People are less likely to visit the doctor if they’re physically harder to get to, or if they’re difficult to make appointments for because of patient load. With a greater degree of rurality, the distance to see primary doctors likely increases more dramatically compared to urban settings. The lack of residential and commercial density in rural areas likely means less public transportation options to attend appointments in a reasonable timespan. People with constrained economic status would suffer similar hardships making appointments given costs of any increased travel burden. High patient-doctor ratios might also decrease time and effort spent on each patient, and rural and low-income populations may not feel such visits are worth the trouble. Lower income immigrant populations might be less able to find providers who they can communicate well with in lower PCP-dense areas, decreasing their willingness to use care and the quality of care they do receive. People with lower incomes also have poorer health status (e.g. obesity, chronic conditions) and higher rates of unhealthy behaviors (e.g. smoking), making it more problematic for them if their access to care is reduced. On the other hand, the need to pay deductibles or copayments with Medicare may have been a deterrent that would have existed no matter how many doctors were nearby, reducing the importance of PCP density. Specific investigations into how these factors interact would be essentially to fully understand their complex interplay.
There are also some caveats specific to my analysis to note. First, our analysis leaves out a number of states and counties in order to promote greater statistical confidence through larger sample sizes. This does reduce the generalizability of the results nationwide and for residents of the most sparsely populated counties. This is also a cross-sectional analysis, and while there is a delay between our access metric and our community health metric, it might not long enough to have captured the full impact of that relationship. The correlation analyses look for simple linear relationships, and wouldn’t identify potentially important non-linearity in those relationships. Additionally, county-level primary care physicians is admittedly a rough proxy for the health care access of its residents. Those living in rural areas may actually have access to health care providers in nearby counties that would be not be perceived in this analysis. Primary care access may also be mitigated by the proliferation of telehealth, though other barriers such as limited broadband access likely contribute to difficulties in utilizing those services. Also, because our access to care metric is physicians per population and our outcome is specifically for Medicare enrollees, there is an indirectness to the metric since those physicians have to non-Medicare populations. For example, our metric might be more accurate in communities with more older adults who are Medicare-eligible.
Ultimately, this work should at least provide additional insight into what states and areas might endure particularly strong repercussions given a decrease in primary care providers due to a confluence of different factors. Further research is needed to anticipate how policy changes interact with sociodemographic factors to impact community health and best target any mitigative measures.